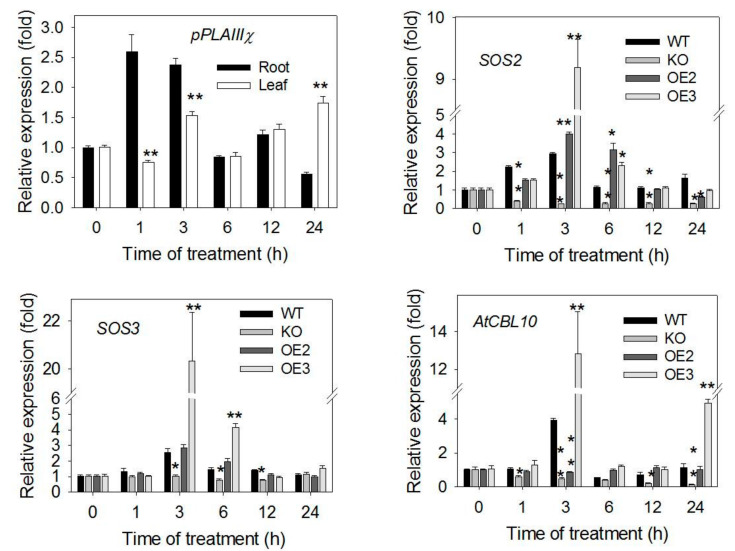
Figure 7.
Transcript levels of pPLAIIIγ and SOS genes in WT, KO and OE lines under 0 and 100-mM NaCl. Transcript level of pPLAIIIγ measured by qPCR in leaves and roots of WT with and without 100-mM NaCl at different time points (1–24 h). Transcript levels of SOS2, SOS3, AtCBL10 quantified by qPCR in roots of WT and KO seedlings with treatments as above. UBQ10 was used as internal control and data represent means ± SE (n = 4 technical repeats). asterisk presents a significant difference at 0.05 level by Students’ t-test.

