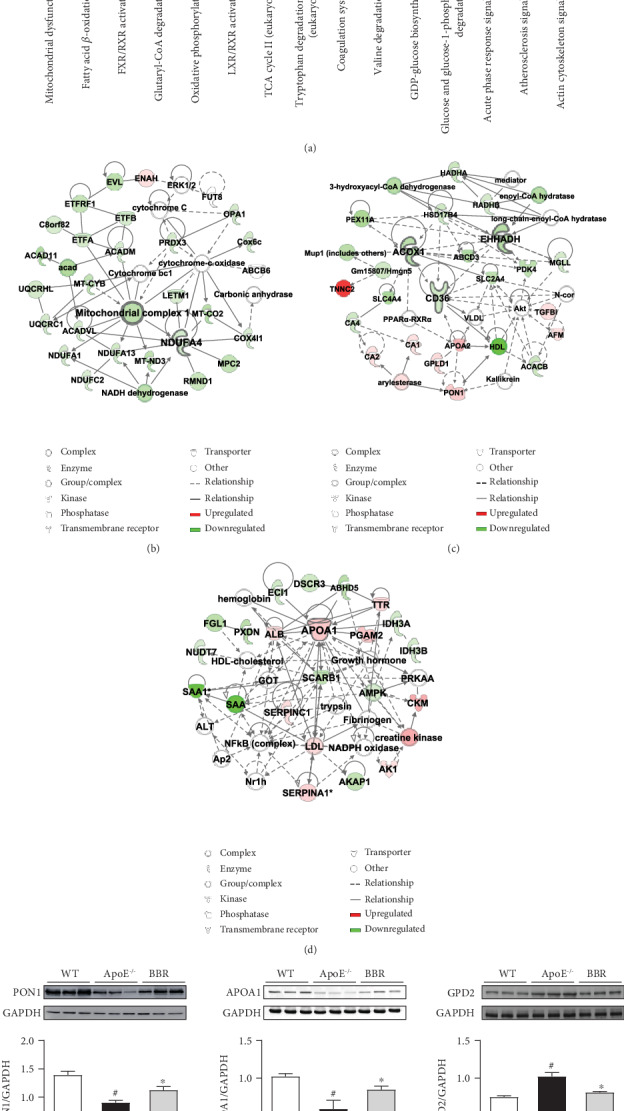
Figure 7.

Ingenuity Pathway Analysis (IPA) and western blotting validation of common differentially expressed proteins. (a) Top 15 canonical pathways according to IPA. The blue bars represent −log(P value), and the orange points denote the ratio of differentially expressed proteins. (b–d) Top 3 networks generated by IPA. Network 1 is involved in metabolic disease, developmental disorder, and hereditary disorder (b); Network 2 is involved in energy production, lipid metabolism, and small molecule biochemistry (c); Network 3 is involved in lipid metabolism, small molecule biochemistry, and vitamin and mineral metabolism (d). (e) Validation of differentially expressed proteins PON1, GPD2, and APOA1 by western blotting. Data are shown as mean ± SEM, n = 5‐6. #P < 0.05 versus WT and ∗P < 0.05 versus ApoE−/−. WT: wild-type; BBR: berberine; PON1: paraoxonase 1; APOA1: apolipoprotein A I; GPD2: glycerol-3-phospate dehydrogenase 2.
