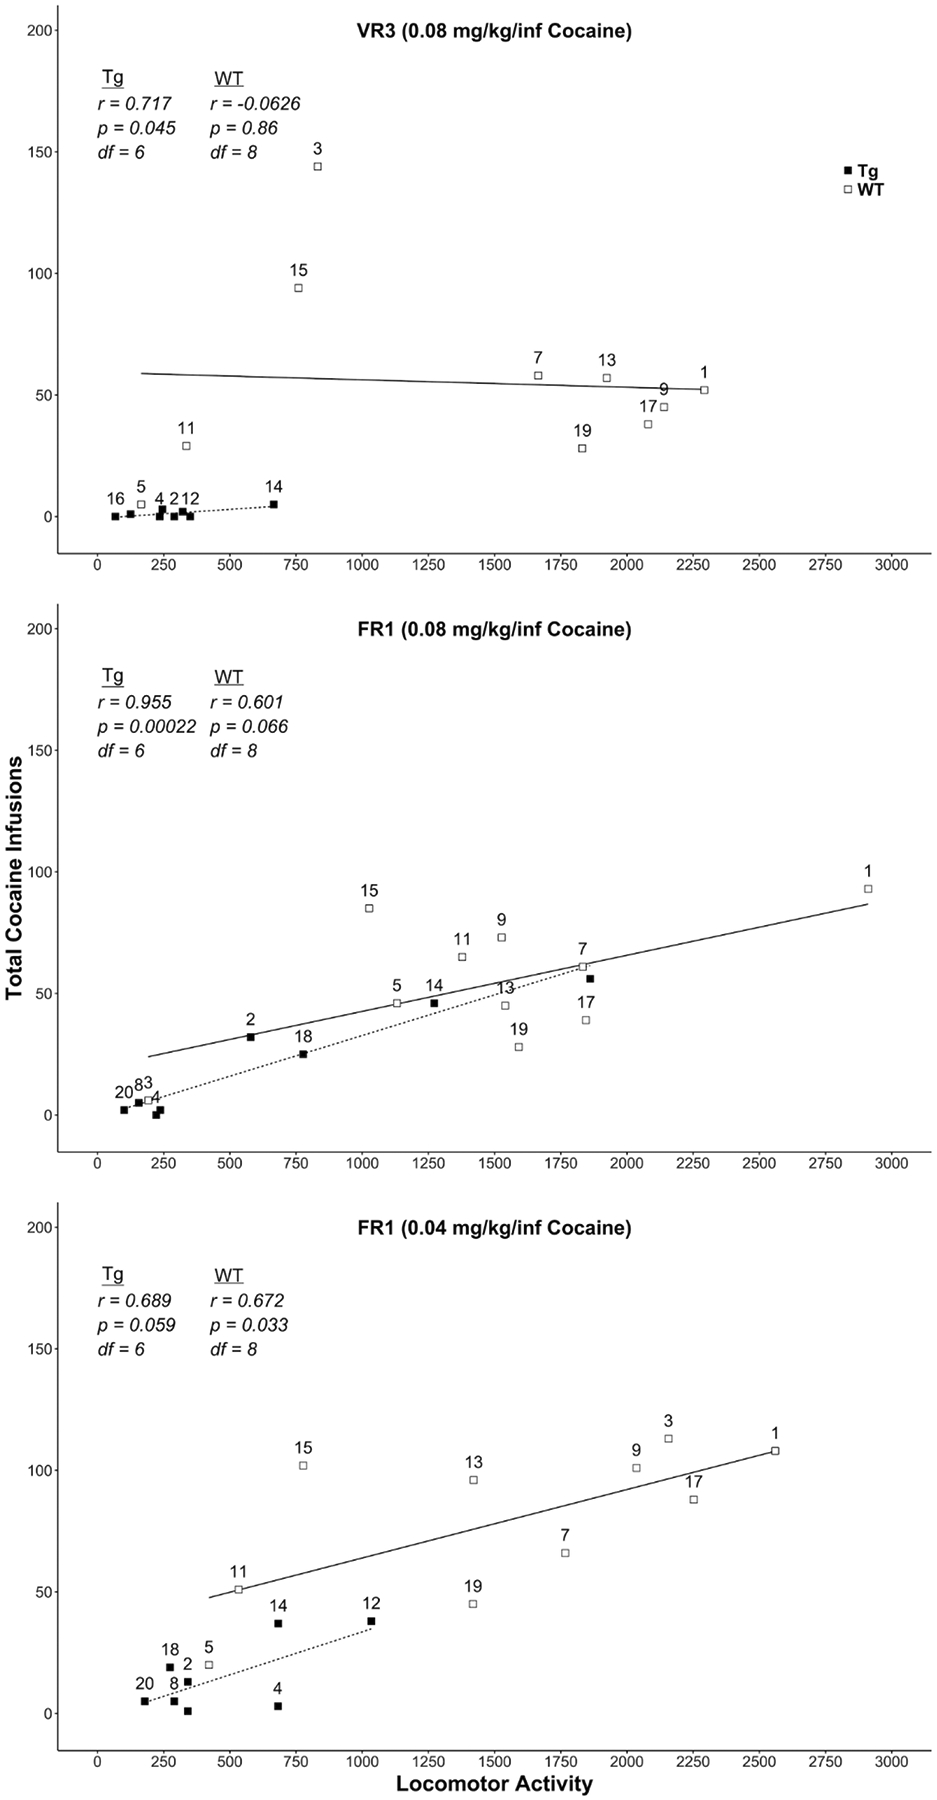
Figure 8.

Scatterplot which depicts the relation between locomotor activity and cocaine infusions. Each panel depicts the final session of the last three training stages for HIV-1 Tg rats (filled symbol) and F344 WT rats (open symbol). Statistical results from Pearson’s correlations are displayed in each panel for both rat strains. Rat identification numbers are labeled above their respective data points where possible. The line of best fit for each training stage was plotted using a linear model. All cocaine doses are in units of mg/kg = milligram per kilogram per intravenous infusion. VR = variable ratio, FR = fixed ratio, WT = wildtype, Tg = transgenic.
