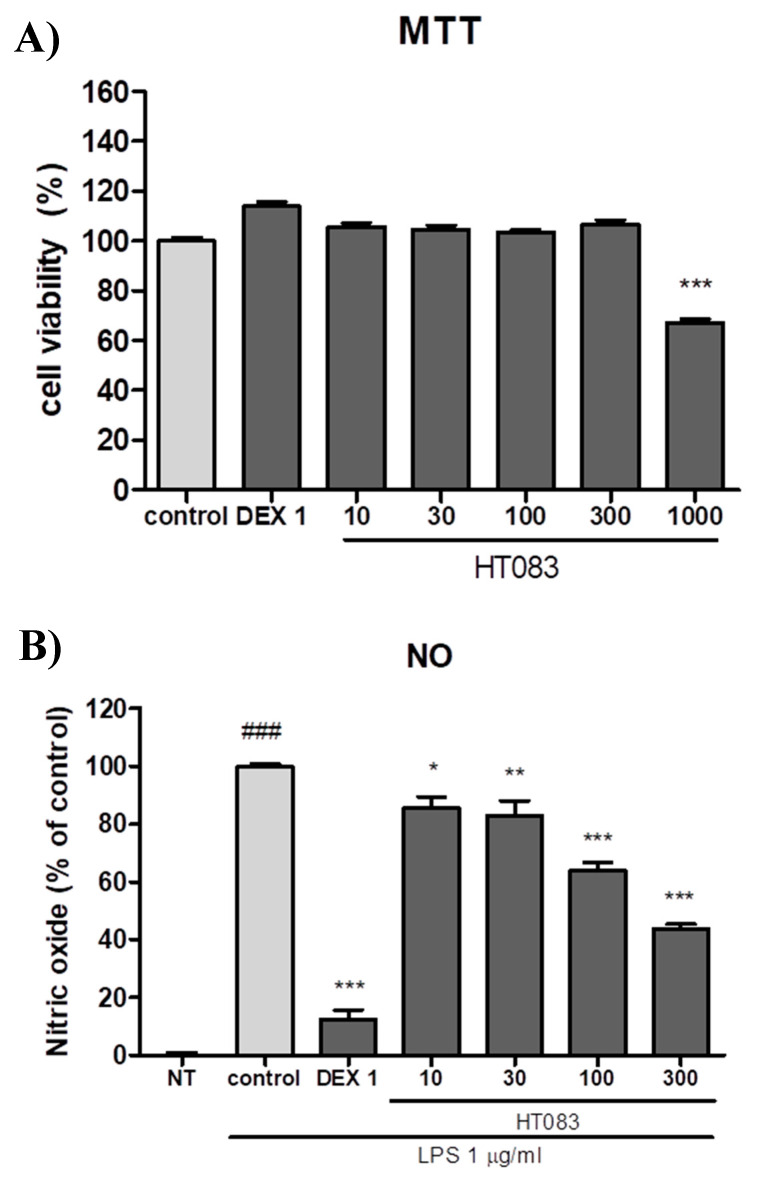
Figure 6.
Effects of HT083 on cell viability (A) and NO production (B) in lipopolysaccharide (LPS)-stimulated RAW 264.7 cells. Cells were pretreated with 10, 30, 100, and 300 μg /mL of HT083. Each value is the mean ± SEM. * p < 0.05, ** p < 0.01 and *** p < 0.001 vs. control; ### p < 0.001 vs. no treatment (NT) (one-way ANOVA, Dunnett’s post hoc test). MTT; thiazolyl blue tetrazolium bromide, NO; nitric oxide.

