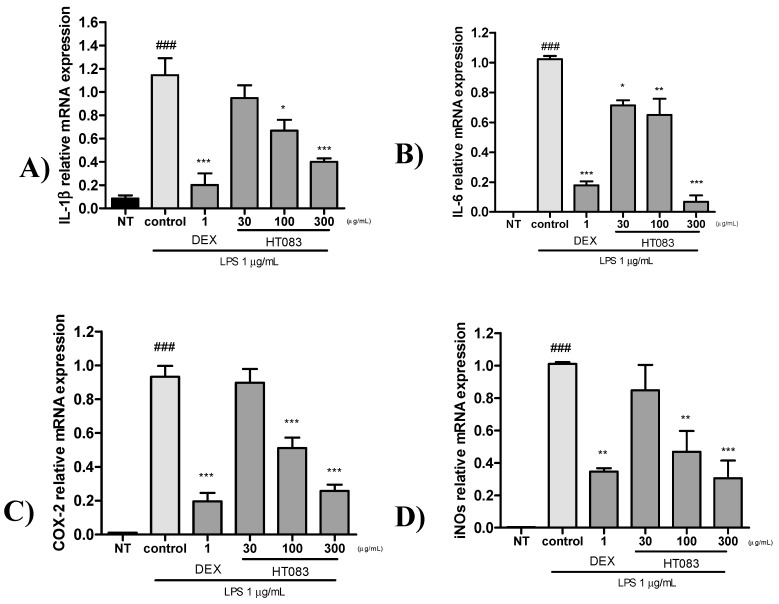
Figure 7.
Quantitative Real Time-PCR (qRT-PCR) analysis of IL-1β, IL-6, COX-2, and iNOS mRNA expression in LPS-stimulated RAW264.7 cells. Cells were pretreated with positive control, Dexmethason 1 μg/mL and HT083 (30, 100, 300 μg/mL), and then incubated with LPS for 24 h. The cells were lysed, and total RNA was subjected to quantitative Real Time-PCR with the primers IL-1β, IL-6, COX-2 and iNOS (A–D). Each experiment was repeated three times. Each value is the mean ± SEM. The number of animals is nine per group; * p < 0.05, ** p < 0.01 and *** p < 0.001 vs. control; ### p < 0.001 no treatment (NT) (one-way ANOVA, Dunnett’s post hoc test).

