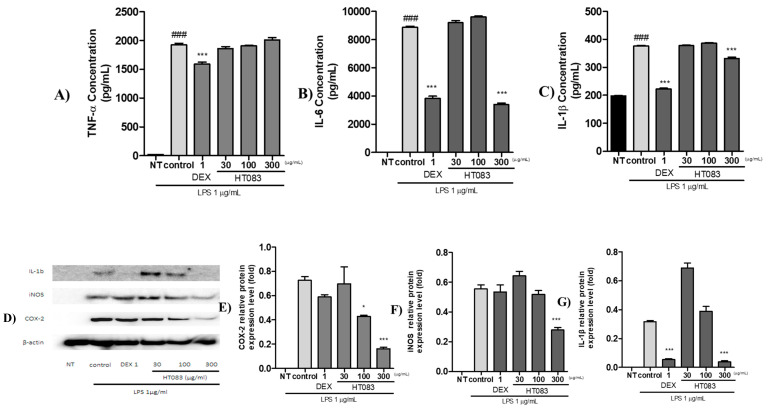
Figure 8.
Effects of HT083 on the protein expression of inflammatory cytokines in LPS-stimulated RAW264.7 cells. (A–C) Multiplex analysis of the expression of TNFα, IL-6, and IL-1β. Cells were stimulated with PBS, trophozoite lysates or LPS for 24 h. Supernatants were harvested and inflammatory cytokine concentrations (pg/mL) were measured. * p < 0.05, *** p < 0.001 indicate statistically significant differences from the control group. ### p < 0.001 indicates significant difference from the non-treated (NT) group. (D–G) Western blot image and analysis of the expression of COX-2, iNOS and IL-1β.

