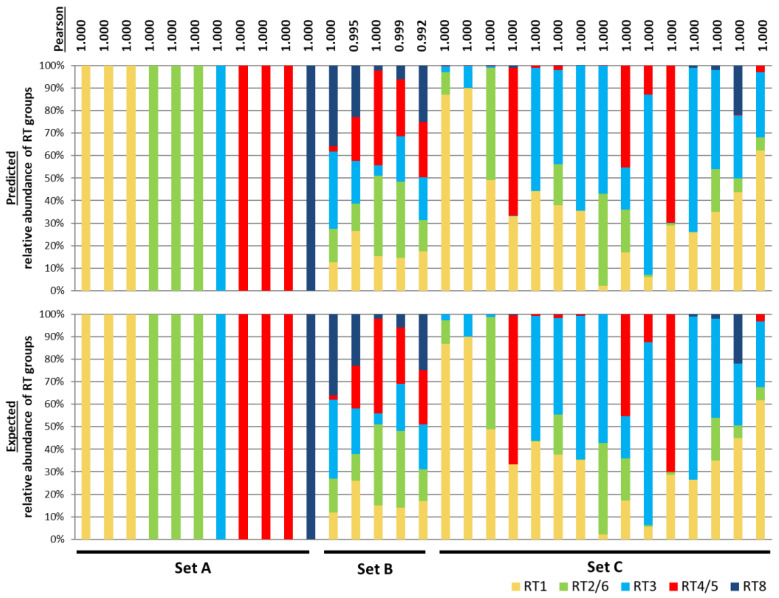
Figure 1.
The strain composition predicted by STRUCTURE is highly consistent with the expected P. acnes populations based on simulated data. The top panel shows the ribotype (RT) group composition predicted by STRUCTURE based on the simulated communities. The bottom panel shows the expected RT group composition. Each column represents the relative abundances of the RT groups in each sample. The expected composition of each simulated community is listed in Table S2. Set A communities were generated to contain a single RT group per sample. Set B communities were generated to randomly have varying relative abundances of the RT groups. Five representative samples among the total 100 simulated communities are shown. Figure S2 lists all 100 communities of Set B. Set C communities were generated to mimic the population structures from previously characterized clinical skin samples [5]. Pearson’s correlations were calculated to compare the predicted population composition with the expected data as shown on the top.

