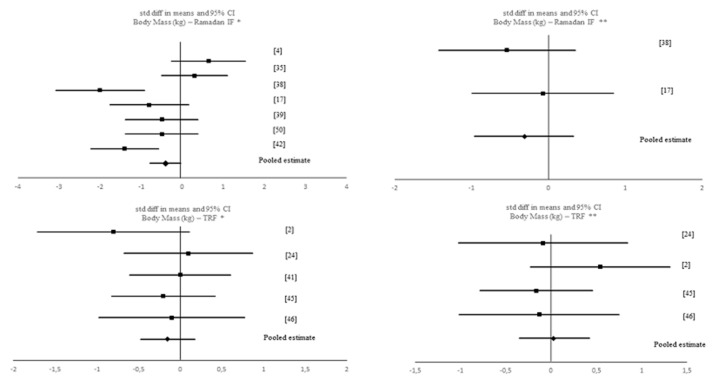
Figure 4.
Forest plot of the effects from a random-effects meta-analysis shown as standardized mean difference with 95% confidence intervals on body mass for * Ramadan IF studies and forest plot of the effects from a fixed-effects meta-analysis shown as standardized mean difference with 95% confidence intervals on body mass for TRF studies. For each study, the square represents the standardized mean difference between pre- and post-intervention time points and, whenever possible, between pre-post data of both intervention and control groups with the horizontal line intersecting it as the lower and upper limits of the 95% confidence interval. The rhombi represents the pooled estimated standardized mean difference. Note. * Pre-post tests, IF intervention; ** Pre-post tests, IF intervention vs. control.

