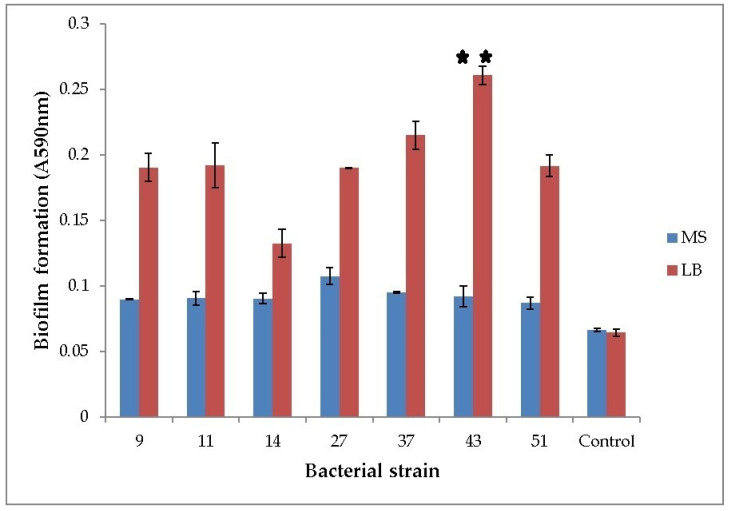
Figure 1.
Biofilm formation of phenol-degrading bacteria. Seven bacterial strains were grown at 25 °C in LB and phenol-supplemented MS medium. Y-axis represents optical density of biofilm (OD590nm). Numbers on the x-axis represent bacterial strains: 9—K. oxytoca, 11—Lelliottia, 14—K. oxytoca, 27—S. marcescens, 37—H. alvei, 43—H. paralvei, 51—S. nematodiphila. Control is sterile medium (LB or MS with phenol). Data represent the mean ± SE (n = 3). Mean with ** is significantly different and signifies the best biofilm formation. One-sample t-test, 6 df, p < 0.01.

