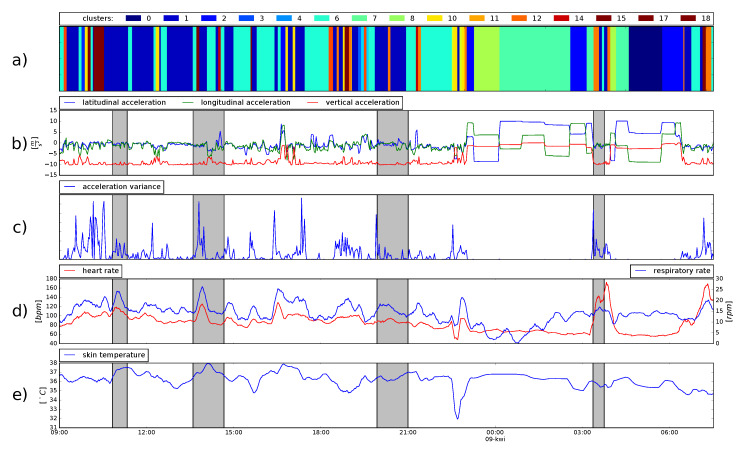
Figure 2.
Exemplary data from a 24 h recording retrieved from one of the participants. Consecutive graphs (marked by subsequent letters of the alphabet) correspond to the same timeline. (a) depicts clusters of motion time series. Motion data consists of three-axial acceleration measurements, and acceleration variance, presented in (b,c) respectively. (d) illustrates changes in HRV (red line, left axis) and respiration rate (blue line, right axis), while (e) shows fluctuations in body temperature.

