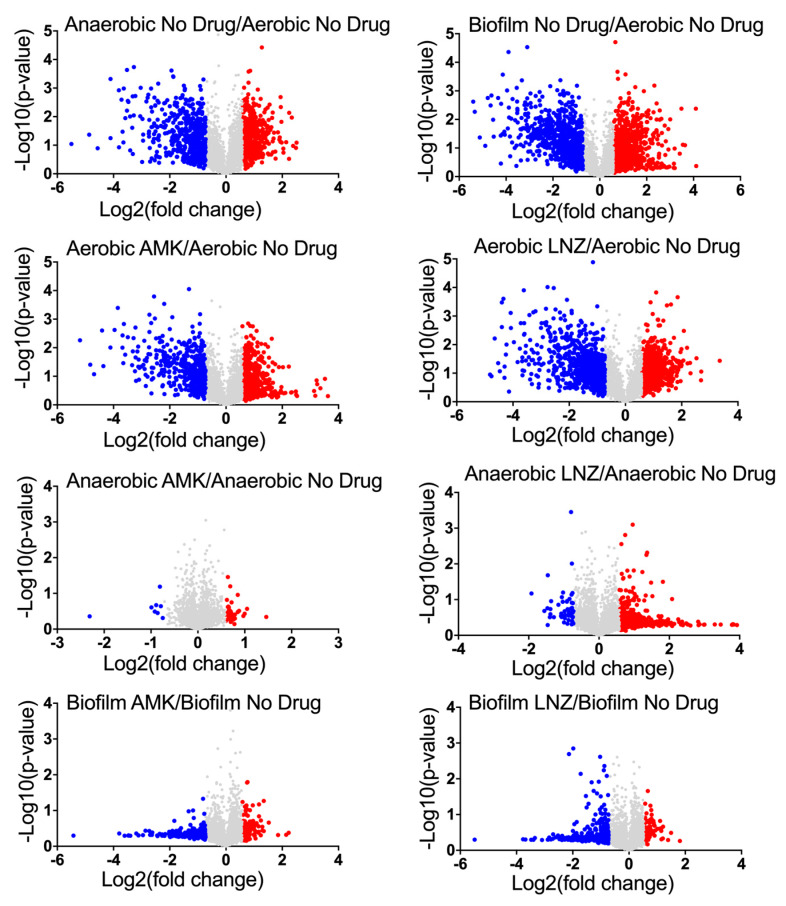
Figure 2.
Volcano plots displaying MAB induced or repressed proteins with and without drug treatments. This plot displays the log2 changes in protein synthesis induced under anaerobic and biofilm conditions when compared with the aerobic control. Protein enrichments of AMK or LNZ treated MAB are compered to proteome obtained under the corresponding condition. Synthesized proteins ≥1.5-fold higher than control are shown in red, and ≥1.5-fold lower than control are in blue; each dot is one protein.

