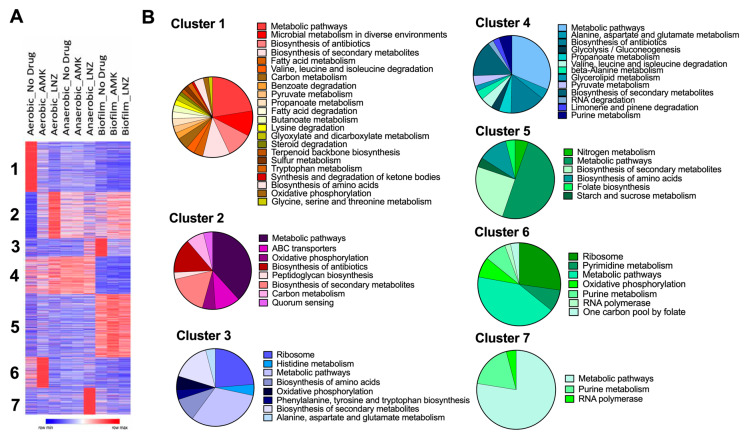
Figure 4.
The heatmap and clustering analysis. (A) The heatmap demonstrates clustering of different protein groups under stress conditions with various enrichment levels in antibiotic or no antibiotic treatment groups. The color reflects the degree of change. K-means clustering was performed for 3722 genes across all studied groups (adjusted p-value < 0.05), and K = 7 was determined as an optimal number. (B) Pie charts correspond to 7 clusters of the heat map and display enriched metabolic pathways of the KEGG (Kyoto Encyclopedia of Genes and Genomes) database.

