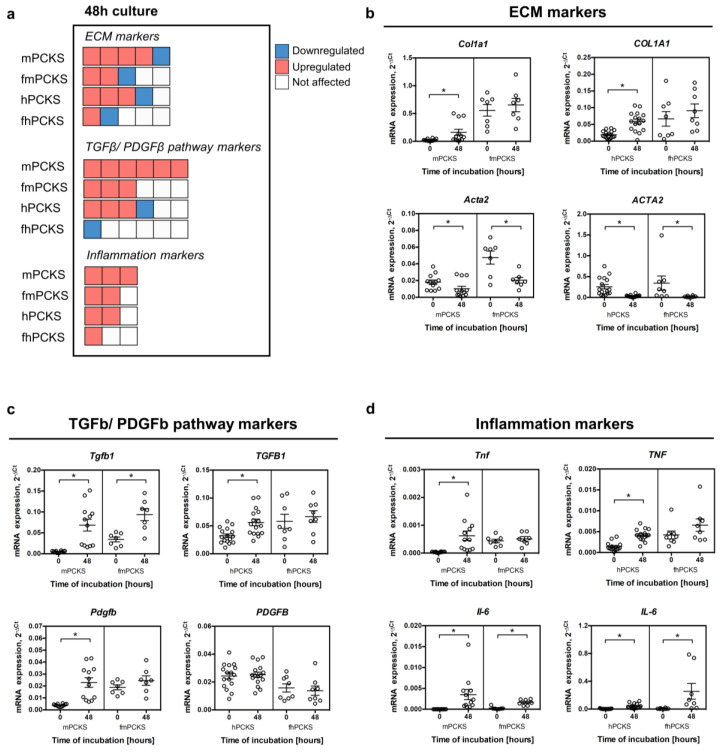
Figure 2.
Culture-induced spontaneous fibrogenic and inflammatory responses in PCKS in relation to species and healthy/diseased phenotype. (a) Visual summary of changes in the transcription of selected genes in murine and human PCKS prepared from normal (mPCKS and hPCKS) and fibrotic kidneys (7dUUO fmPCKS and fhPCKS) after 48-h culture. Each box represents one gene, while the direction of change is indicated by the color: red, upregulated during 48-h culture; blue, downregulated; and white, not affected by culturing. This diagram only indicates the number of altered genes (without specifying the marker genes) and the direction of change, in the following order: upregulation, downregulation, and no change. Evaluated genes were divided into three categories: extracellular matrix (ECM) markers (COL1A1, ACTA2, SERPINH1, FN1, and PLOD2), markers of TGFβ and PDGF signaling (TGFB, TGFBR1, TGFBR2, SERPINE1, PDGFB, and PDGFRB), and inflammation markers (TNF, IL-1B, and IL-6). (b–d) Examples of regulated transcripts in each category: ECM markers (b); markers of TGFβ and PDGF pathways (c); and markers of inflammation (d). Regulation of rest of the transcripts is illustrated in Figure S2. Data are expressed as mean ± SEM, n = 3–5 (murine PCKS) or n = 5–7 (human PCKS); * p < 0.05.

