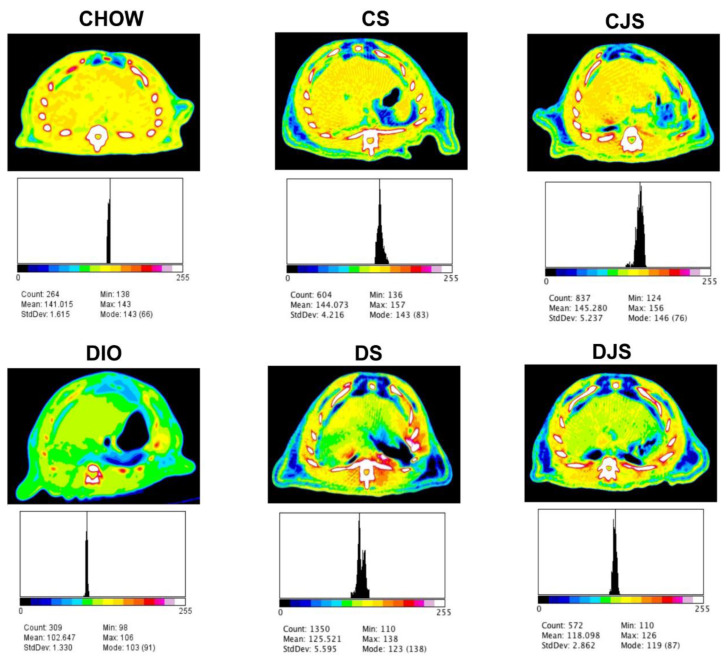
Figure 4.
Computed tomography (CT) images evaluation with Image J software. The grayscale Digital Imaging and Communications in Medicine (DICOM) images obtained with CT were converted into pseudo-color images, which starts with the lowest density of black pixels (value of 0, air) and increases gradually, depending on the tissue density, to white pixels (value of 255, bone). The hepatic optical density for the different groups of rats ranged from 102.647 to 145.280, as reported below each image. The black peak in each histogram indicates the distribution of the optical density of the regions of interest investigated. CHOW—control rats with standard diet; CS—CHOW plus tart cherry seeds; CJS—CHOW plus tart cherry seeds and juice; DIO—diet-induced obese rats; DS—DIO plus tart cherry seeds; DJS—DIO plus tart cherry seeds and juice.

