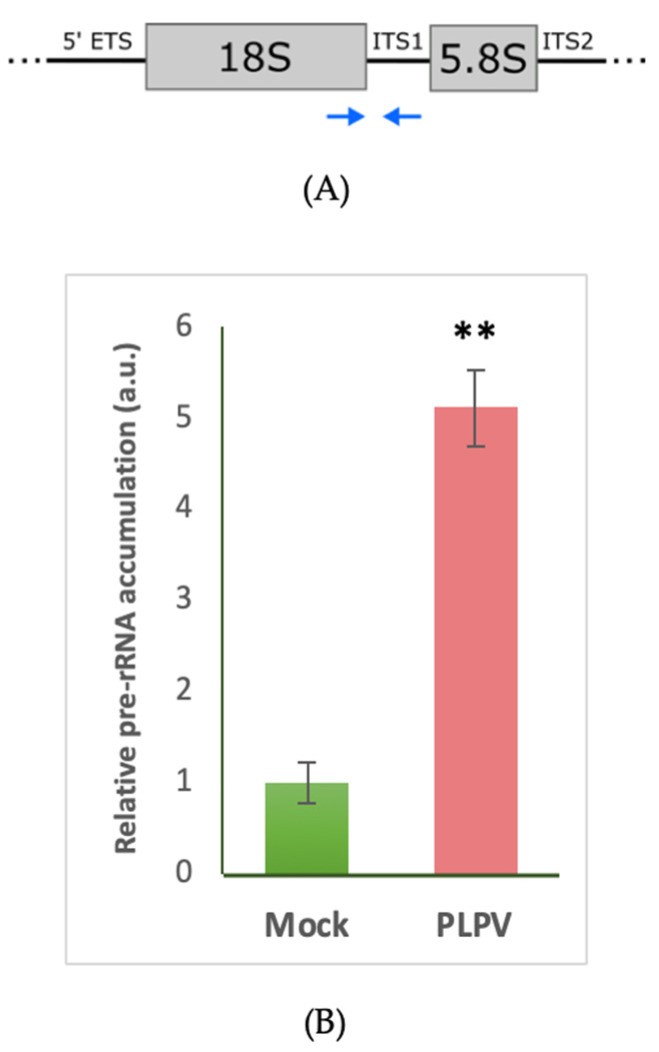
Figure 3.
Relative accumulation of pre-rRNA. (A) Fragment of the rRNA unit. Blue arrows below depict the position of the primers used in the analysis. (B) RT-qPCR analysis of systemic leaves from mock-inoculated (green) and PLPV-infected (red) plants harvested at 34 d.p.i. Bars depict standard deviations from three independent biological replicates and the statistical significance was tested using a paired t-test (** p < 0.01).

