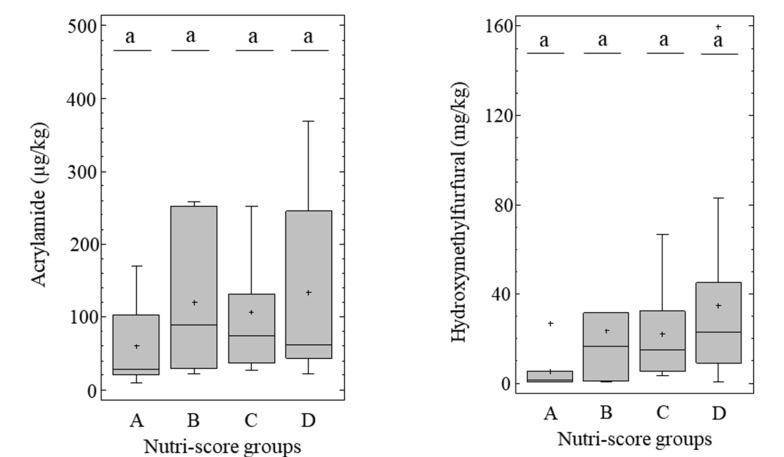
Figure 4.
Bar plot showing the distribution of acrylamide (µg/kg) and hydroxymethylfurfural (mg/kg) content between the different NutriScore groups (ANOVA and Bonferroni post-hoc test, p < 0.05). Different letters indicate significant differences among Nutriscore groups. Nutri-score A (n = 10), B (n = 7), C (n = 20), D (n = 16).

