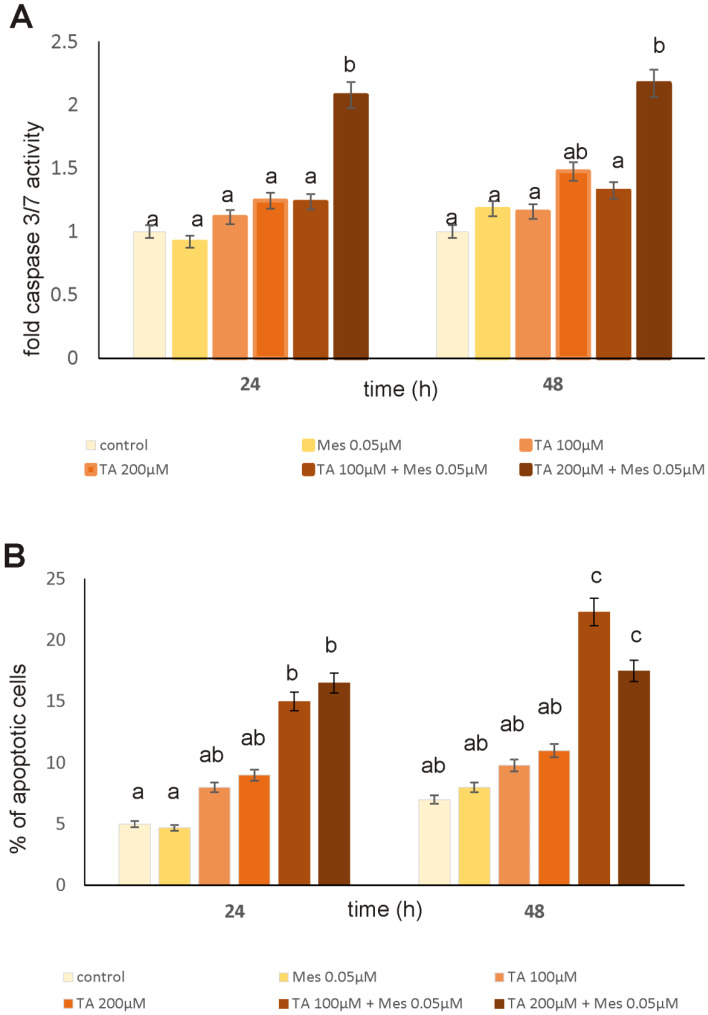
Figure 2.
The effect of TA, Mes, and the combination of TA+Mes on apoptosis in ZR-75-1 cells, which were incubated with 100 µM of TA, 200 µM of TA, 0.05 µM of Mes, and a mix of 100 µTA + 0.05 µM Mes, 200 µM TA + 0.05 µM Mes. (A) Caspase 3/7 activity in ZR-75-1 cells under the influence of TA, Mes and TA + Mes on, (B) Bar graphs presenting the percentage of apoptotic cells. Mean values from three independent experiments ± SD are shown. Different letters indicate statistical differences (p ≤ 0.05) between treatments estimated by Tukey’s test.

