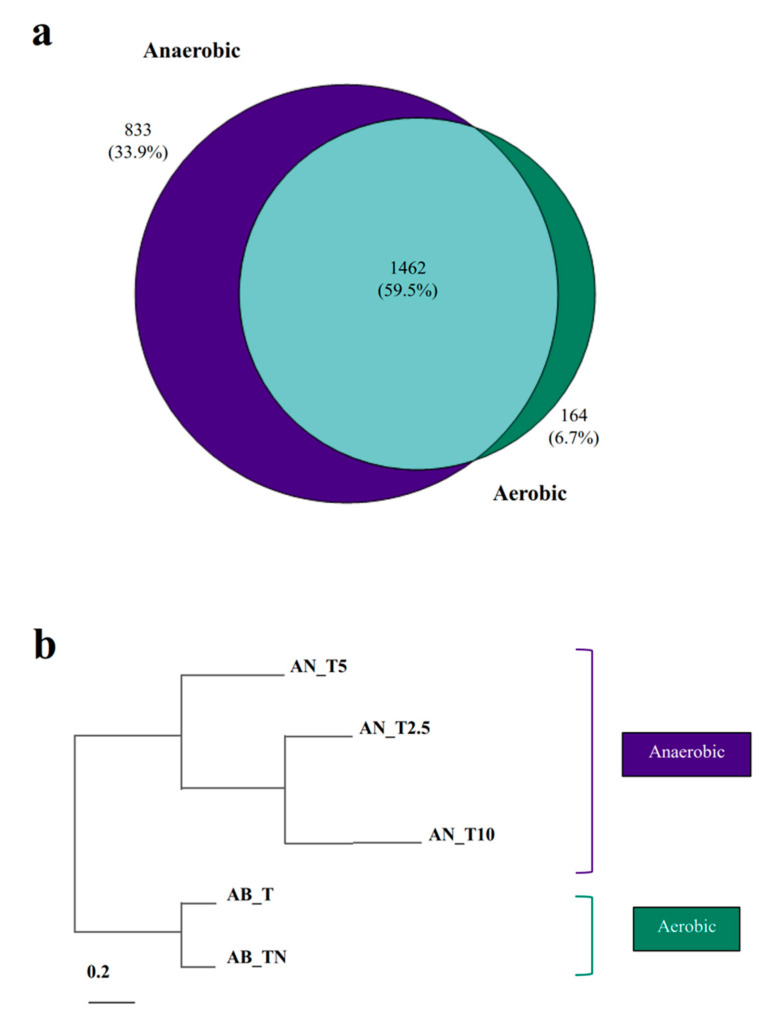
Figure 3.
Proteome changes in response to oxygen and nitrate. Total and shared proteins (a) and hierarchical clustering of proteome profiles (b) among oxic and anoxic conditions with different nitrate concentrations are shown. AN_T represents cultures growing anaerobically with toluene and either 2.5 mM (AN_T2.5), 5 mM (AN_T5), or 10 mM (AN_T10) of KNO3. AB_T represents cultures growing aerobically with benzoate and supplied additionally with either toluene alone (AB_T) or toluene and 5 mM of KNO3 (AB_TN).

