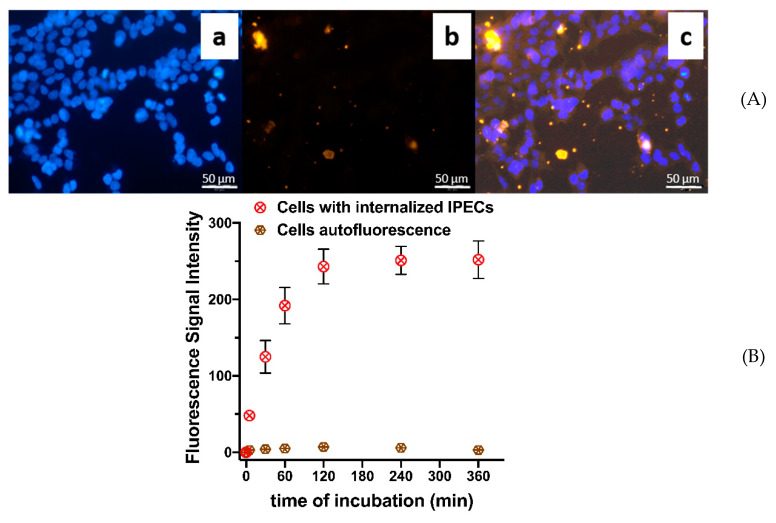
Figure 10.
IPECs cellular internalization studies: (A) Visualization of IPECs cellular internalization by fluorescent microscopy: a—DAPI-stained cells; b—Cy5-labeled IPECs; c—merging of a and b. Time of co-incubation—2 h; (B) Fluorescence signal intensity after incubation of HEK 293 cells with cross-linked IPEC ([Lys–NH3+]:[Hep–SO3−]:[linker] = 1:3:0.8). The IPEC concentration—0.1 mg/mL. The data are given as mean ± SD (n = 5).

