Figure 2.
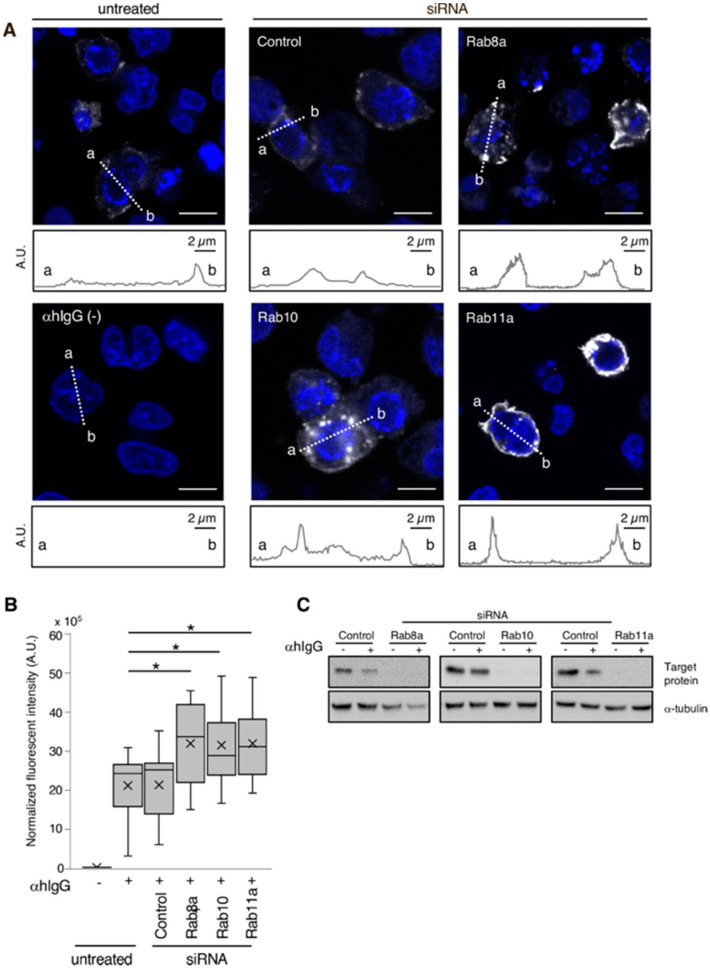
The effect of Rab GTPase downregulation in EBV glycoprotein distribution. Rab8a, Rab10 and Rab11a were downregulated in Akata+ cells using siRNAs. After 48 h of treatment with αhIgG for the EBV lytic cycle induction, the distribution of EBV glycoprotein gp350/220 was analyzed by immunofluorescence staining. (A) Images of gp350/220-specific signals (white) are shown. As a control, the images of the siRNA-untreated cells with (top left) or without (bottom left) the lytic cycle induction are shown. Cell nuclei were counterstained with Hoechst 33342 and appear in blue. Plots indicate the fluorescence intensity along each of the corresponding lines. A.U., arbitrary unit. Scale bars: 10 µm. (B) Summary of gp350/220 expression. Boxplots represent the fluorescent intensities from gp350/220-positive cells in four independent randomly selected fields. Results are representative of three times independent experiments. Average (a cross), median (a line), and standard deviations values are shown. Statistical differences were assessed using Student’s t test and are represented as * p < 0.05 versus respective control. (C) Downregulation of Rab proteins was confirmed by Western blot.

