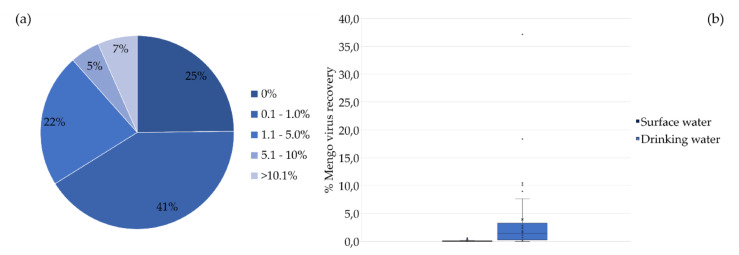
Figure 4.
Recovery of the process control virus (%) in the water samples analyzed. (a) Mengo virus recovery in surface water and drinking water samples (n = 59). (b) Box plot generated with Mengo virus recoveries in samples from surface water and drinking water samples (n = 59); X represents the average recovery value.

