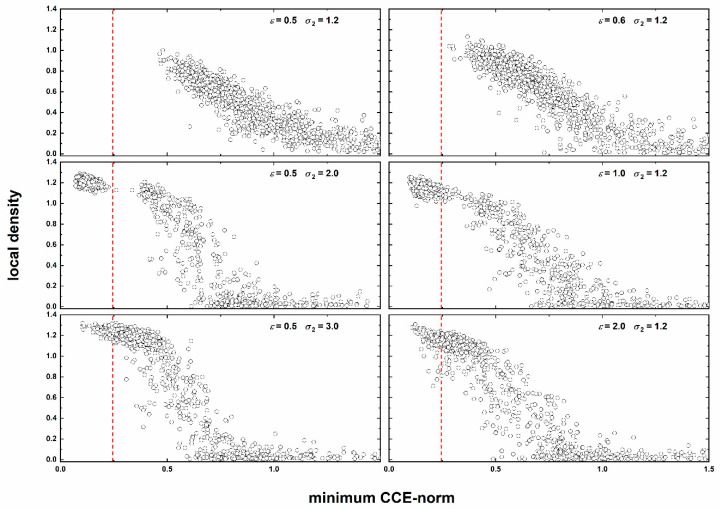
Figure 14.
Parity plot of the local density as a function of the minimum CCE norm for all sites of the last recorded configuration for: (top panel) amorphous, (middle panel) crystal, and (bottom panel) glassy SW chain clusters. The vertical red dashed line denotes the threshold value (μc = 0.245) for the identification of HCP, FCC or FIV local environments for non-overlapping spheres.

