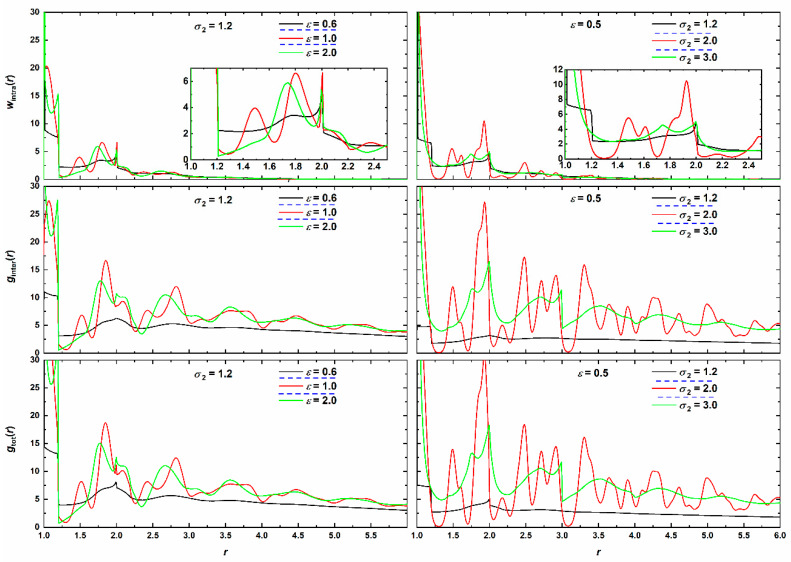
Figure 15.
(Top panels) Intramolecular density function, wintra(r); (middle panels) intermolecular pair distribution function, ginter(r) and (bottom panels) total pair radial distribution function, gtot(r) as functions of radial distance, r, for (left column) various attraction intensities, ε, for fixed range (σ2 = 1.2) and (right column) various attraction ranges, σ2, for fixed intensity (ε = 0.5). Black, red and green correspond to SW chain clusters being amorphous, crystalline and glassy, respectively. Insets in the wintra panels correspond to zoom into short radial distances and the analogous peaks. Dashed horizontal blue lines in legend identify transitions to different phase regimes: amorphous crystalline glassy.

