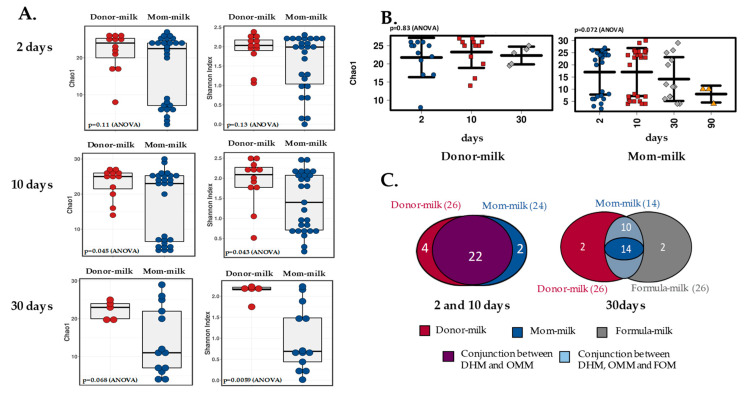
Figure 2.
Bifidobacterium diversity. (A) Alpha diversity between groups. Chao1 and Shannon index comparisons between the DHM and OMM milk groups at 2 (n = 12 and n = 26, respectively), 10 (n = 12 and n = 27, respectively), and 30 (n = 5 and n = 13, respectively) days of life. (B) Alpha diversity over time. Chao1 index over time comparison in the DHM and OMM milk groups (n = 3 at 90 days). (C) Venn diagram. Number of unique and shared species in the babies’ groups over time. Colors and groups are explained in each figure.

