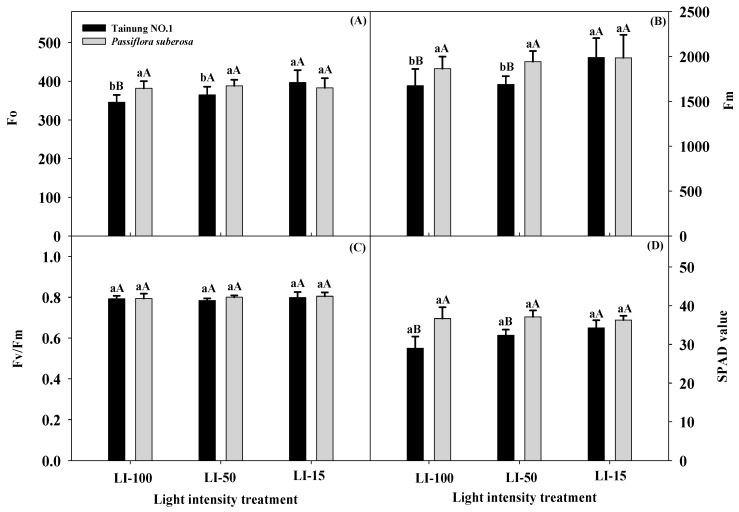
Figure 2.
Effects of light intensity on minimal fluorescence (Fo) (A), maximal fluorescence (Fm) (B), maximum photochemical efficiency of photosystem II (Fv/Fm) (C), and soil-plant analysis development (SPAD) values (D) of Tainung No. 1 and Passiflora suberosa plants. Data were recorded and calculated after 2 months of light-intensity treatment of six replicates. Means within a light treatment followed by different lowercase letters significantly differ at p ≤ 0.05 by the least significant difference (LSD) test. Means within the same light treatment of the two species followed by different capital letters significantly differ at p ≤ 0.05 by the LSD test. Each treatment was assumed to be dependent on the other. LI-100 (100% light intensity, non-shaded, as the control), LI-50 (50% light intensity, 50% shaded), and LI-15 (15% light intensity, 85% shaded) represent the average light intensity passing through in each treatment at 1396, 619, and 187 μmol m−2s−1 PPFD, respectively.

