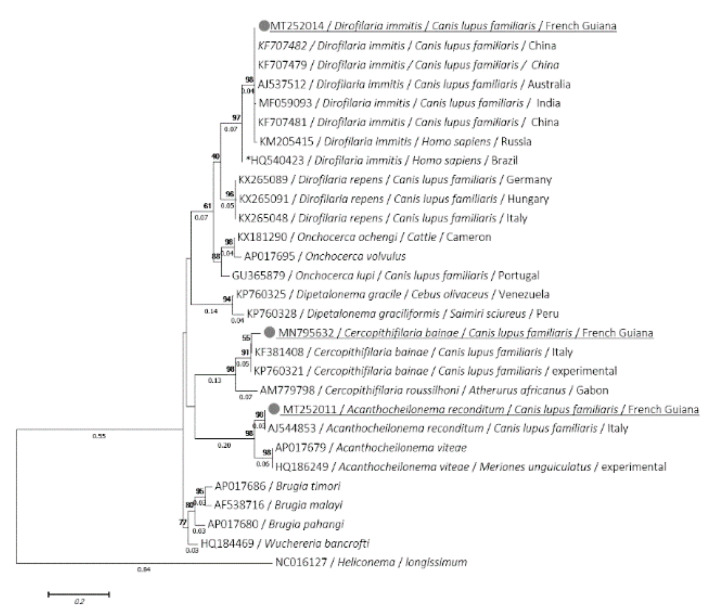
Figure 4.
Phylogram of the 12S rRNA gene generated by maximum likelihood method from 29 partial (421) sequences. The tree with the highest log likelihood 5-2356.1682) is shown. A discrete Gamma distribution was used to model evolutionary rate differences among sites (5 categories (+G, parameter = 0.6437)). Numbers above and below branches are the display of bootstrap replicate values and branches length, respectively. Host, geographical location (when available) and GenBank accession number are indicated in each node. The sequences of the present study are underlined. *: indicates the most virulent strain of D. immitis from Latin America [39].

