Figure 5.

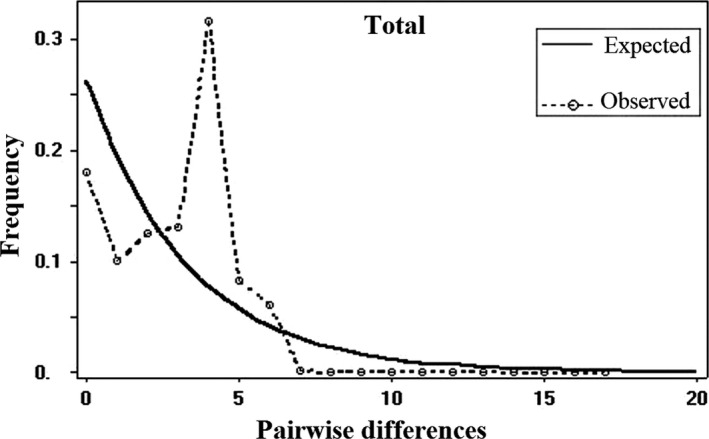
Mismatch distributions of the pairwise total population of Neurergus derjugini. The dashed lines represent the observed frequency of pairwise differences among sequences, and the lines show the expected distribution

Mismatch distributions of the pairwise total population of Neurergus derjugini. The dashed lines represent the observed frequency of pairwise differences among sequences, and the lines show the expected distribution