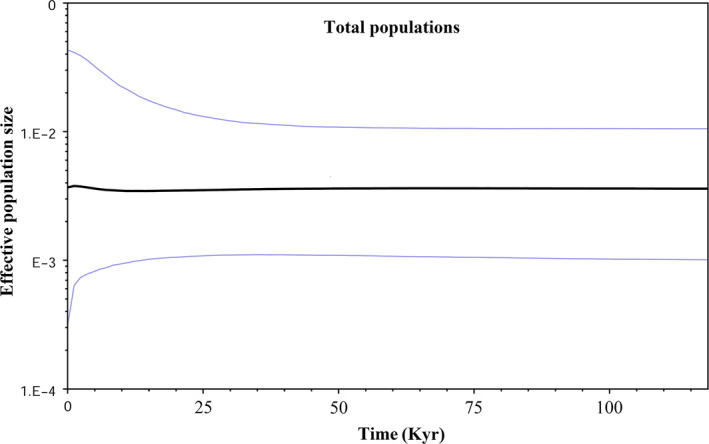
Figure 6.

Bayesian skyline plots (BSPs) for Neurergus derjugini. BSPs derived using a mitochondrial ND4 sequences mutation rate of 0.64 per million years (Myr). The median estimates are shown as blue lines, and the 95% HPD limits are shown by the width areas between blue lines
