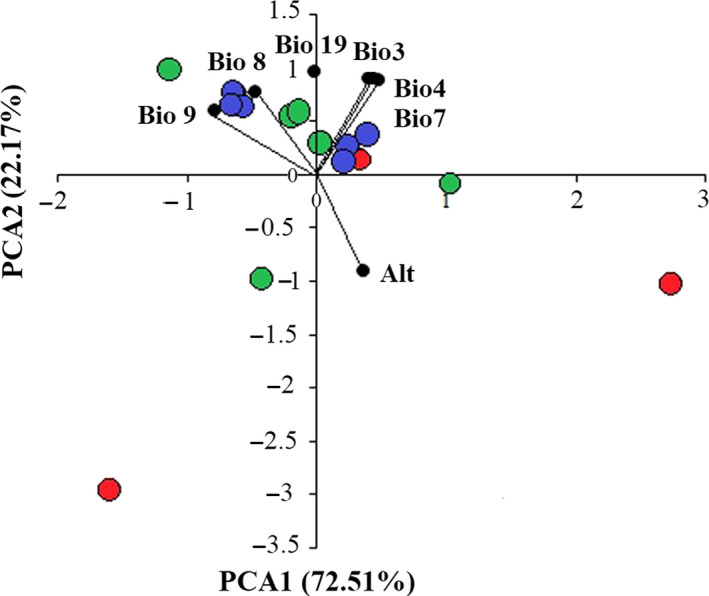
Figure 8.

Plot of PCA based on environmental variables describing Neurergus derjugini localities. The populations in the northern (red circles), central (green circles), and southern (blue circles) regions were not separated along the PC1 and PC2 describing 15 Neurergus derjugini localities
