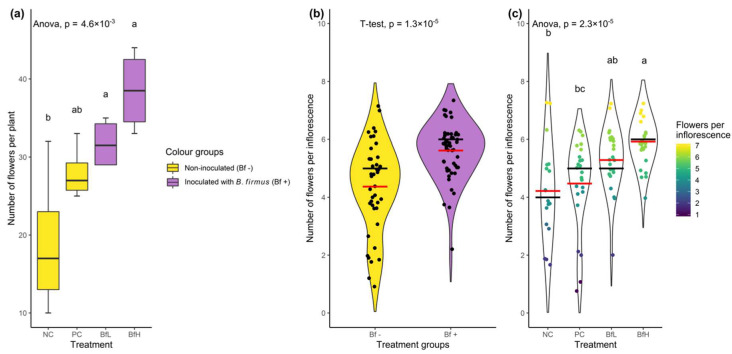
Figure 1.
Data from the pot experiment showing the number of flowers per plant according to (a) treatment (dataset size, n = 16) and (b) the number of flowers per inflorescence in Bacillus firmus-inoculated/non-inoculated plants (n = 93), or (c) according to four tested treatments (n = 93). The numbers of flowers per plant are presented with the box plot and coloured according to the presence or absence of bacterial inoculum. Data for the number of flowers per inflorescence are presented with a violin plot with median (black bar) and mean values (red bar). The outline of the violin plot is a density function representing the underlying data frequency. Individual data points in the right-hand pane were coloured according to the number of flowers in each inflorescence (going from violet/blue representing smaller inflorescences to yellow for larger ones). Treatment means were separated using Tukey’s HSD (a,c) or a T-test (b). Means sharing a letter are not significantly different at p < 0.05. NC—negative control; PC—positive control (nematicide); BfL—low B. firmus inoculum; BfH—high B. firmus inoculum.

