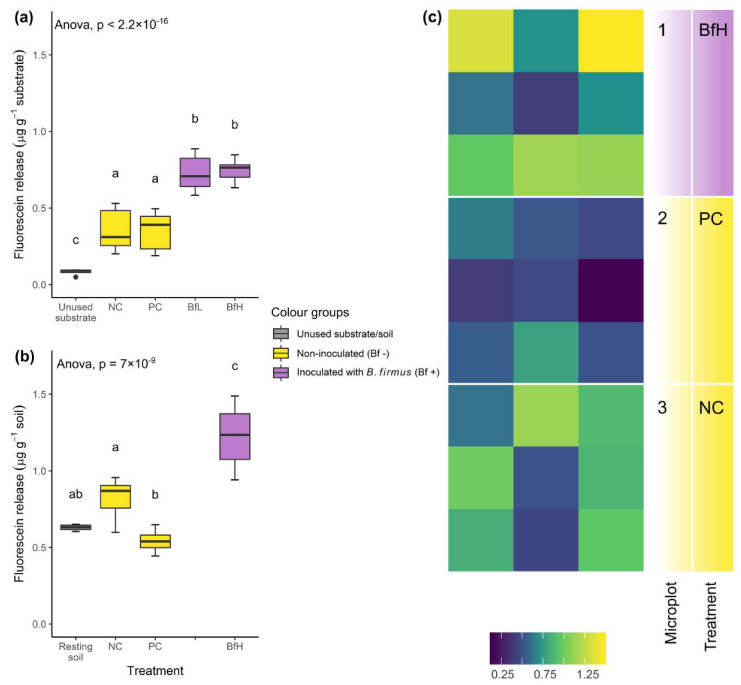
Figure 2.
Microbial activity measurements of the substrate and soil from (a) pot experiments and (b) microplot experiments with different treatments. Data from the pot (n = 16) and microplot experiments (n = 12) are presented with a box-plot showing the results of ANOVA and Tukey’s HSD test. Treatments sharing a letter were not significantly different at p < 0.05 and are coloured according to the presence or absence of Bacillus firmus inoculum. (c) Spatially resolved total microbial activity in the microplot soil, as measured by fluorescein release (µg g−1), ranging from lower (violet-blue) to higher (yellow) enzymatic activity, presented in an area heatmap. NC—negative control; PC—positive control (nematicide); BfL—low B. firmus inoculum; BfH—high B. firmus inoculum.

