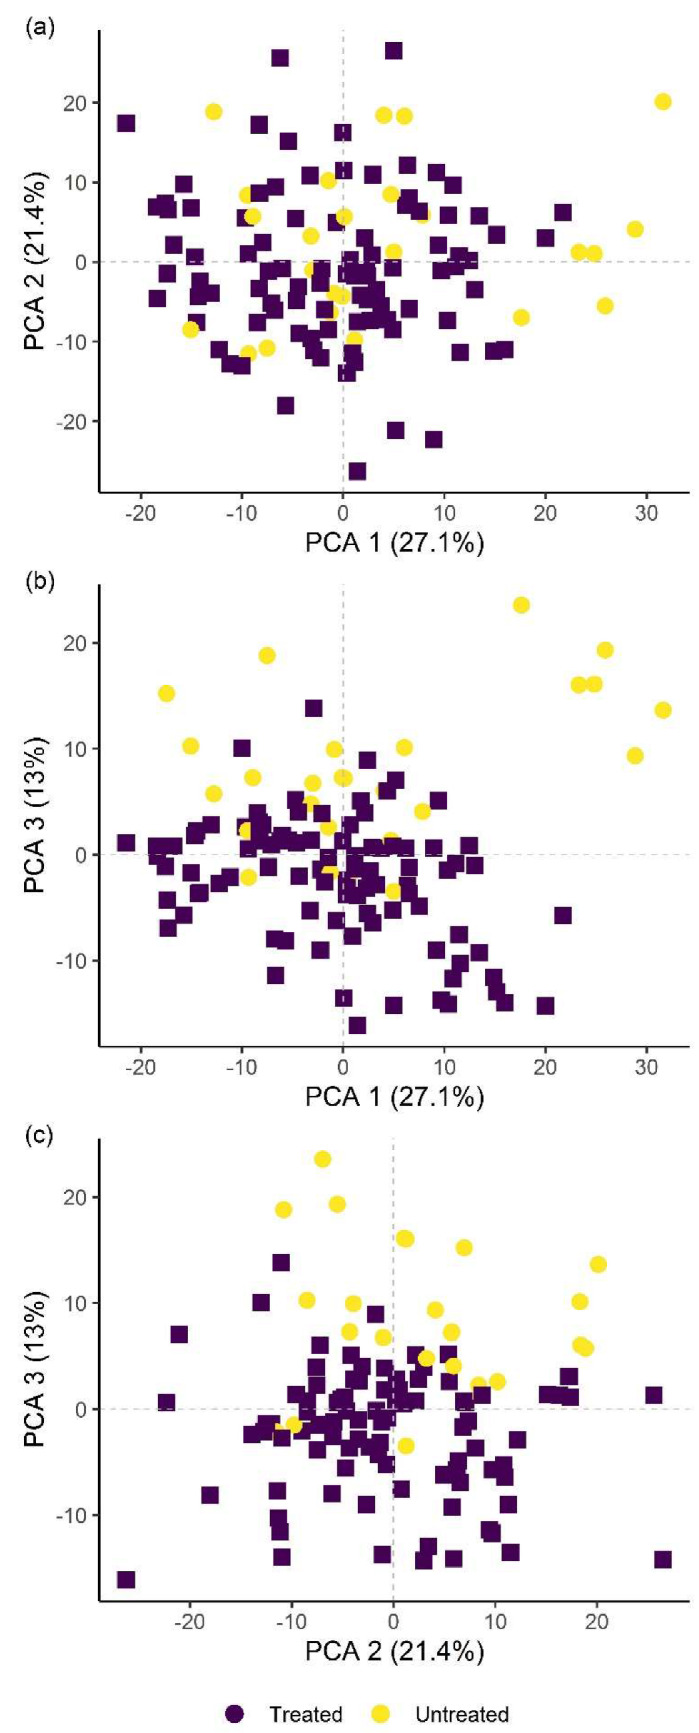
Figure 4.

Principal component analysis (PCA) score plots showing the variation in plant groups from the pot experiment with regard to treated (PC, BfL and BfH) or untreated plants (NC). The first three principal components (PCA 1, 2 and 3) explain more than 60% of observed variability and are presented in the combinations (a) PCA 1–2; (b) PCA 1–3; and (c) PCA 2–3. NC—negative control; PC—positive control (nematicide); BfL—low B. firmus inoculum; BfH—high B. firmus inoculum.
