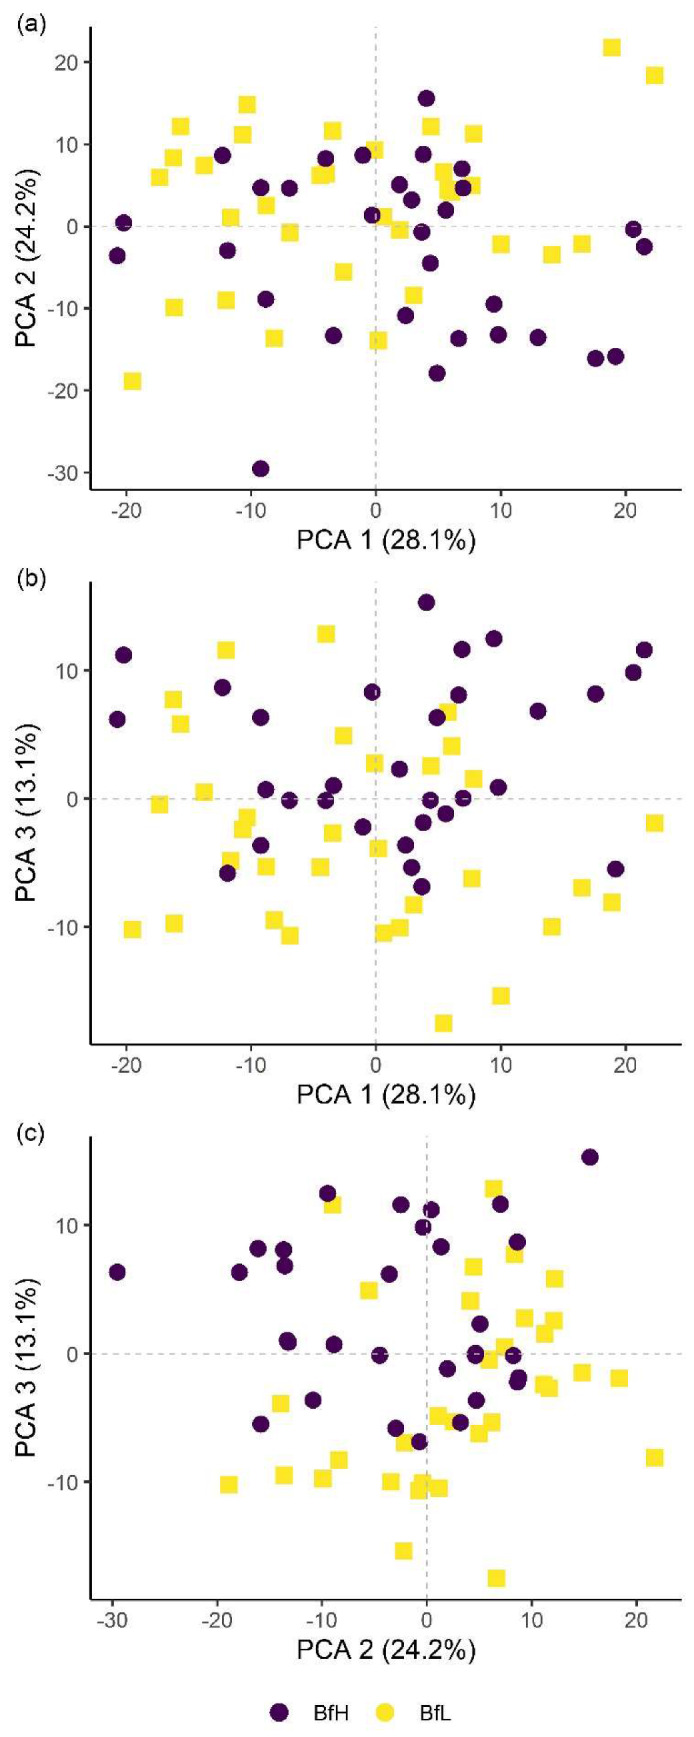
Figure 6.

Principal component analysis (PCA) score plots showing the variation in plant groups from the pot experiment in plants treated with high (BfH) or low-Bacillus firmus inoculum (BfL). The first three principal components (PCA 1, 2 and 3) explain more than 65% of observed variability and are presented in the combinations (a) PCA 1–2; (b) PCA 1–3; and (c) PCA 2–3.
