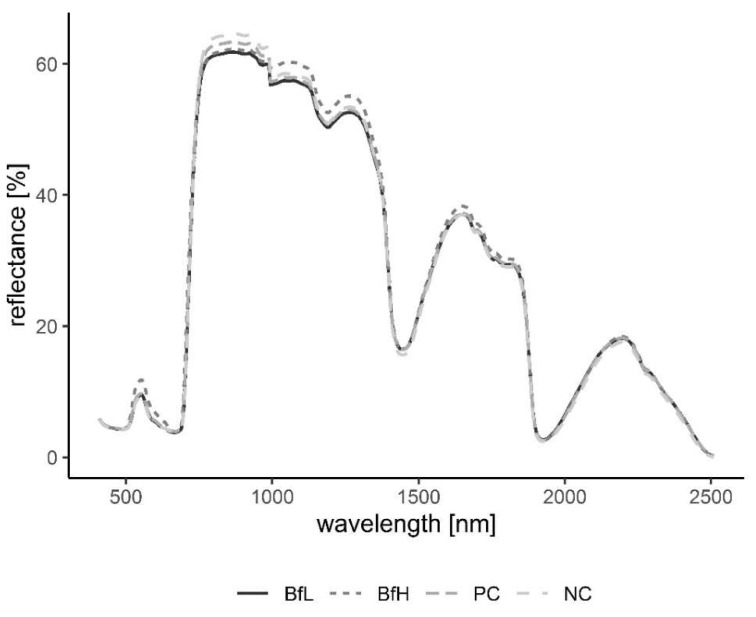
Figure 7.
Averaged spectral signatures of the plants delineating the changes in reflectance at different wavelengths in the recorded spectrum. Signatures grouped according to treatments NC, PC, BfL and BfH in the pot experiment. Sample size per treatment, n = 4. NC—negative control; PC—positive control (nematicide); BfL—low B. firmus inoculum; BfH—high B. firmus inoculum.

