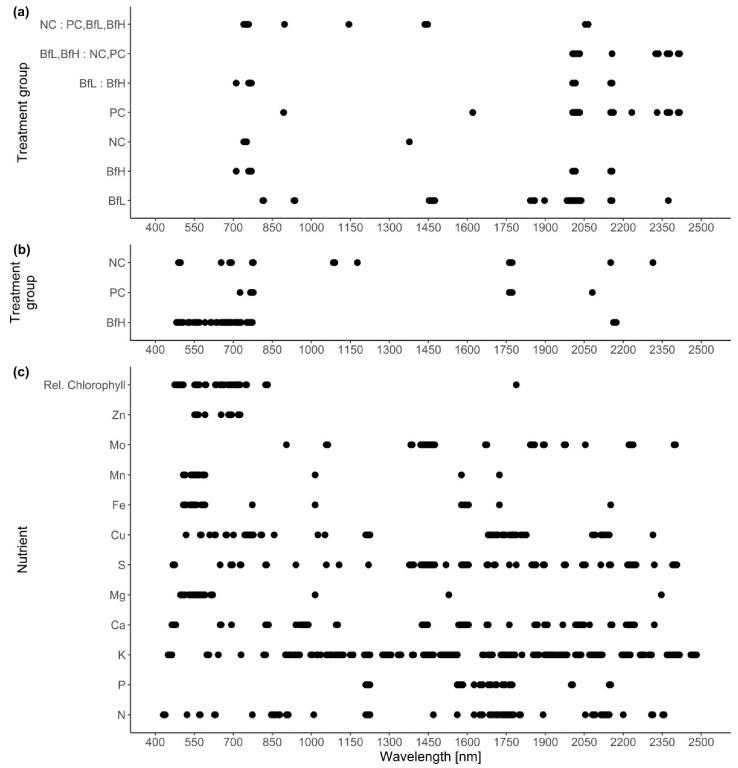
Figure 9.
Loadings of the first partial least squares discriminant analysis (PLS-DA) (a,b) and partial least squares regression (PLS-R) (c) component for the pooled samples. The data points show spectral ranges with correlation values higher than 0.7 or lower than −0.7 in (a) the pot experiment, (b) the microplot experiment and (c) the nutrient content datasets. NC—negative control; PC—positive control (nematicide); BfL—low B. firmus inoculum; BfH—high B. firmus inoculum.

