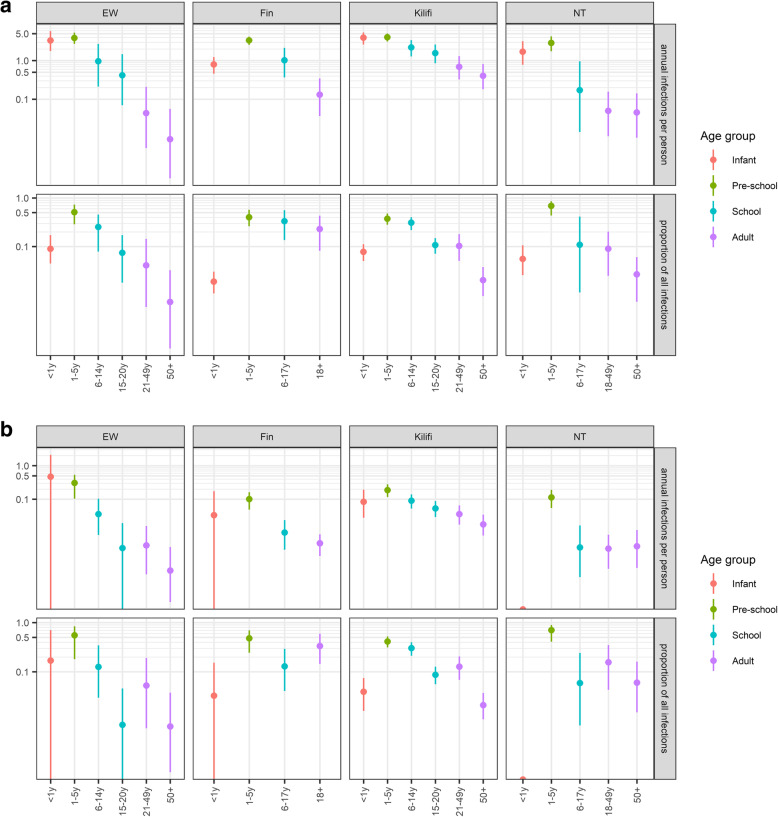
Fig. 2.
Attribution of vaccine serotype pneumococcal infections to population age strata that cause those infections for the four study sites Kilifi, England and Wales (EW), Nha Trang (NT) and Finland (Fin). Top panel: The top row illustrates the per capita annual number of infections in the total population that can be attributed to the respective population age strata (x-axis). Similarly, the bottom row illustrates the proportion of infections in the total population that can be attributed to respective age strata (x-axis). Bottom panel: The top row illustrates the per capita annual number of infections among infants that can be attributed to the respective population age strata (x-axis). Similarly, the bottom row illustrates the proportion of infections among infants that can be attributed to respective age strata (x-axis)

