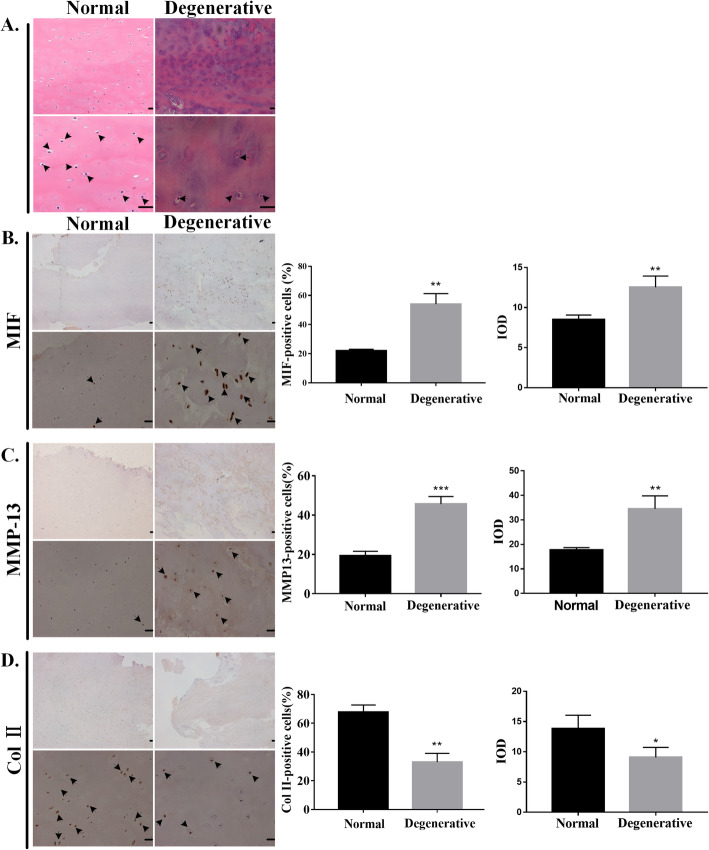
Fig. 1.
Changes in degenerated human CEPs. a Hematoxylin and eosin (H&E) staining is shown in the normal control and degenerated groups. Immunohistochemistry of b MIF, c MMP-13, and d Col II are shown in the normal control and degenerated groups. The left side is the control group and the right side is the experimental group. The upper panels were amplified at × 40, while the lower panels were amplified at × 200. The black arrow represents immunopositive cells. The quantified results are shown on the right. CEP = cartilaginous endplate. MIF = macrophage migration inhibitory factor. MMP-13 = matrix metalloproteinase-13. Col II = type II collagen. Scale bar: 20 μm. *p < 0.05, **p < 0.01, ***p < 0.001

