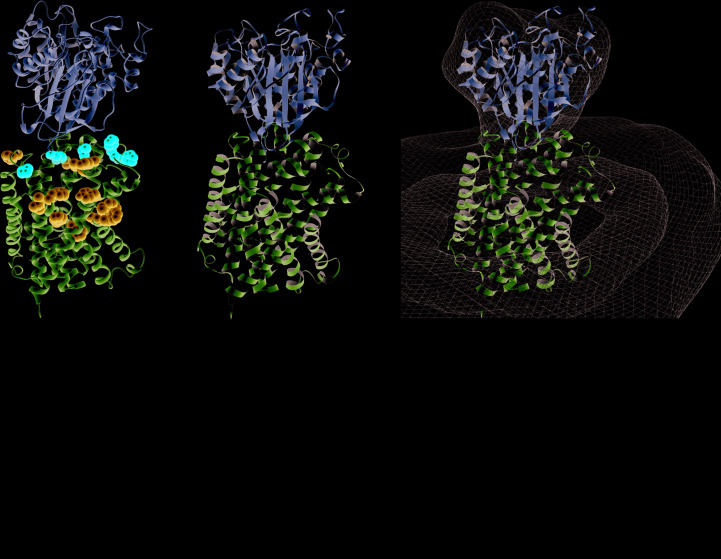
Figure 6.
Comparison of the LAT1–CD98hc dimer interface predicted from homology to LAT2 with EM data. (a) Model of the CD98hc ectodomain (tan) and LAT1 (pink) from docking into the EM map shown as a ribbon with putative interfacial residues shown as spheres. Residues within 10 Å of the CD98hc ectodomain in the EM-based model are shown in red and those at >10 Å are shown in blue (Supplementary Table S2). (b) The docking solution of the CD98hc ectodomain and LAT1 shows a similar orientation of subunits as in the consensus cryo-EM map. (c) An in silico heterodimer model docked into the last frame of the volume series of PC3. (d) The distance between the N atoms of residues of LAT1 (chain A) and CD98hc (chain B) across the frames of a molecular-dynamics movie generated from the volume series along the first three principal components describing the variance between LAT1 and CD98hc in the EM data. The legend gives the residue name, chain and atom.

