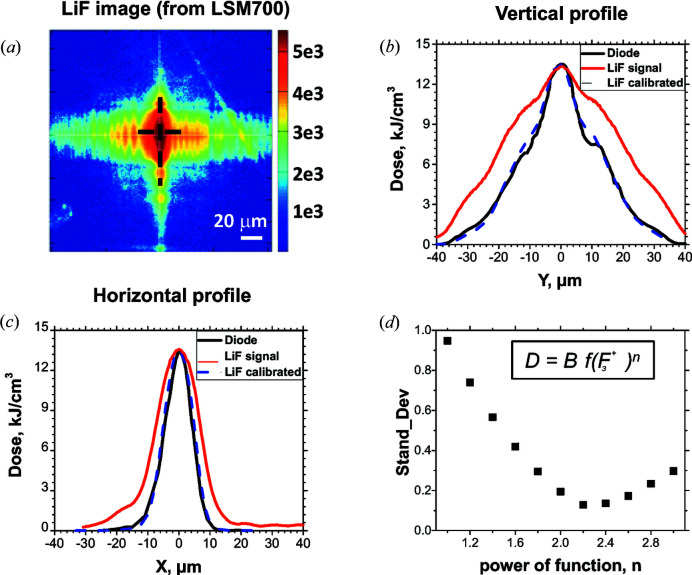
Figure 3.
(a) A confocal laser-scanning microscope image of the irradiated LiF crystal behind the 100 µm slit. (b, c) Vertical and horizontal profiles of the X-ray dose distribution. The solid black line represents the diode measurements, the solid red line represents the LiF data normalized to the diode one, and the dashed blue line represents the LiF data calibrated by using the crystal response function found in Section 4. Black dashed lines in (a) illustrate the areas over which the profiles were measured. (d) Dependence of the standard-deviation value between the diode and LiF data on the power index n of the response function.

