Figure 5.

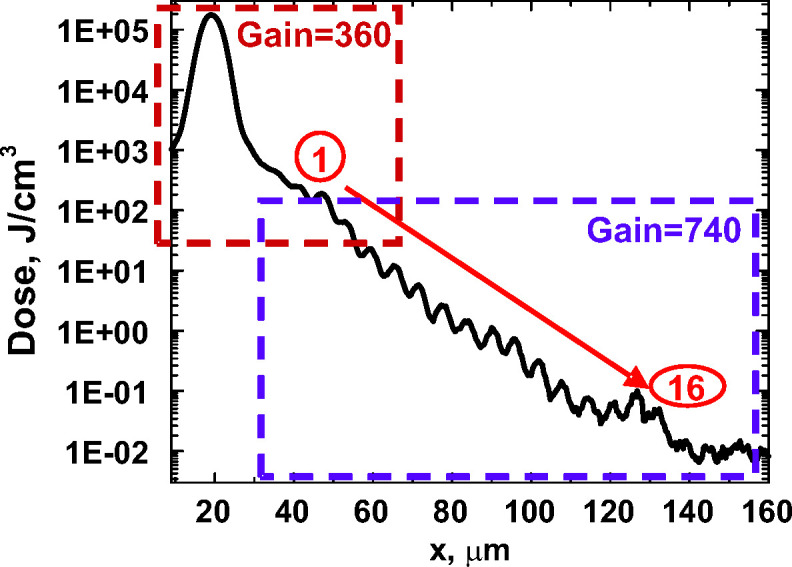
The dose distribution restored along the dashed white line in Fig. 4 ▸ (after applying the crystal-response function found in Section 4).

The dose distribution restored along the dashed white line in Fig. 4 ▸ (after applying the crystal-response function found in Section 4).