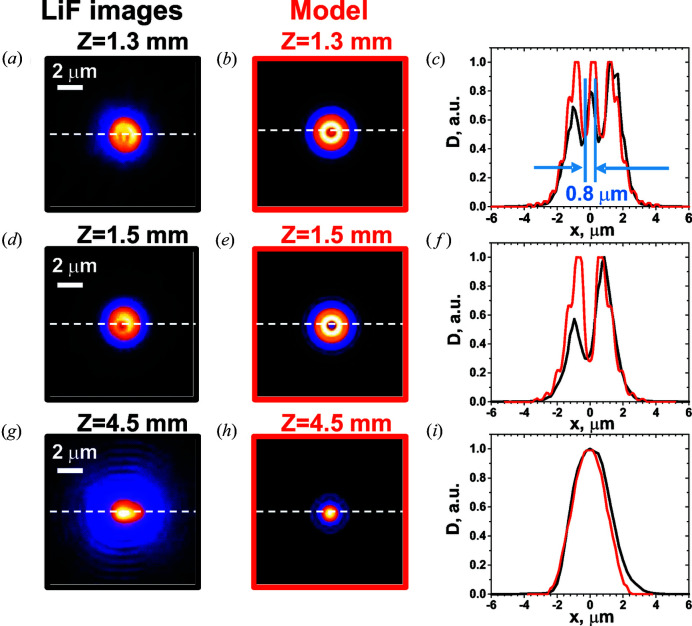
Figure 6.
A sequence of PL images obtained on the surface of the LiF detector in different planes z [(a), (d) and (g)]. Plane-wave simulations for the propagation of the wavefield from a 5 µm pinhole aperture are shown in (b), (e) and (h). The dose distribution along the dashed white lines for experimental (black) and simulated (red) data are shown in (c), (f) and (i).

