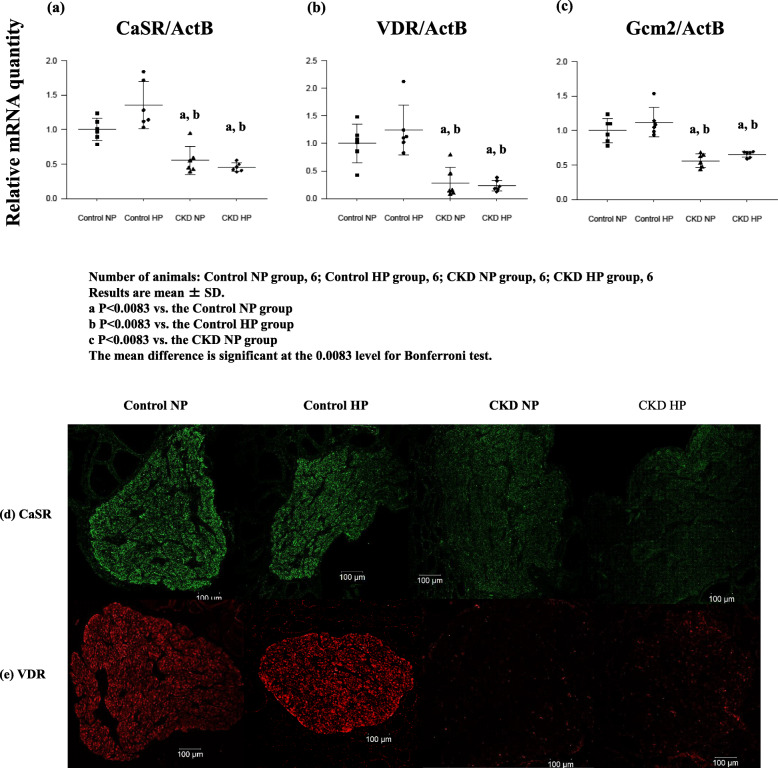
Fig. 2.
Gene expression (a, b, c) and typical immunohistochemical findings (d, e) of CaSR and VDR respectively in PTGs resected from each of four groups: Control NP rats, Control HP rats, CKD NP rats, and CKD HP rats. a, b, cCaSR, VDR, and Gcm2 RNA levels decreased significantly with or without high phosphorus environment. Gene expression data were measured using real-time RT-PCR and normalized to β-actin. d, e Representative immunohistochemical findings of CaSR, and VDR were shown. This result was in agreement with that of gene expression analysis. Number of animals: (a, b, c) Control NP, 6; Control HP, 6; CKD NP, 6; and CKD HP, 6; (d, e) Control NP, 3; Control HP, 3; CKD NP, 3; and CKD HP, 3. Results are presented as the mean ± SD. The mean difference is significant at the 0.0083 level for Bonferroni test

