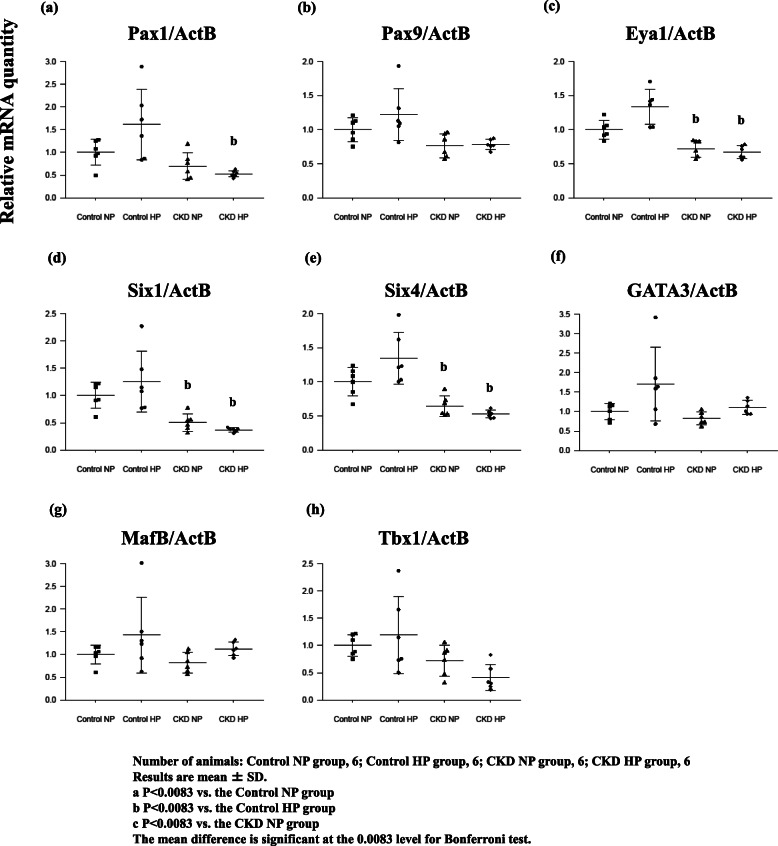
Fig. 3.
Various key gene expressions concerned with the development of PTGs, Pax1 (a), Pax9 (b), Eya1 (c), Six1 (d), Six4 (e), Gata3 (f), MafB (g), Tbx1 (h), obtained from rats in each group: Control NP rats, Control HP rats, CKD NP rats, and CKD HP rats. All gene expression tended to increase in Control NP rats; however, there was no significant difference. GATA3 and MafB tended to decrease in the CKD NP rats, but did not show any significant difference. In CKD HP rats, the expressions were almost equivalent to that in the Control NP rats. The expressions of other genes tended to decrease in the CKD NP rats and CKD HP rats; however, there was no significant difference compared with the Control NP rats. Gene expression data was measured using real-time RT-PCR and normalized to β-actin. Number of animals: (a) Control NP, 6; Control HP, 6; CKD NP, 6; and CKD HP, 6. Results are presented as the mean ± SD. The mean difference is significant at the 0.0083 level for Bonferroni test

