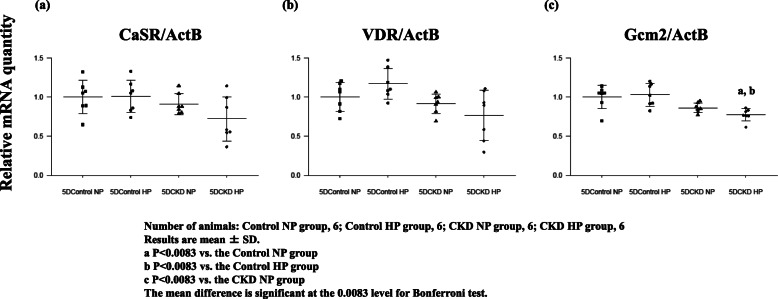
Fig. 5.
Gene expression of CaSR (a), VDR (b), and Gcm2 (c) of PTGs in adenine-induced rats for five days, obtained from rats in each group: 5Dcontrol NP rats, 5Dcontrol HP rats, 5DCKD NP rats, and 5DCKD HP rats. The 5DCKD NP rats and 5DCKD HP rats showed a trend of decrease in the expression of the three genes; however, only Gcm2 in 5DCKD HP rats had a significant difference compared with 5DControl groups. Gene expression data were measured using real-time RT-PCR and normalized to β-actin. Number of animals: (a) 5DControl NP, 6; 5DControl HP, 6; 5DCKD NP, 6; and 5DCKD HP, 6. Results are presented as the mean ± SD. The mean difference is significant at the 0.0083 level for Bonferroni test

