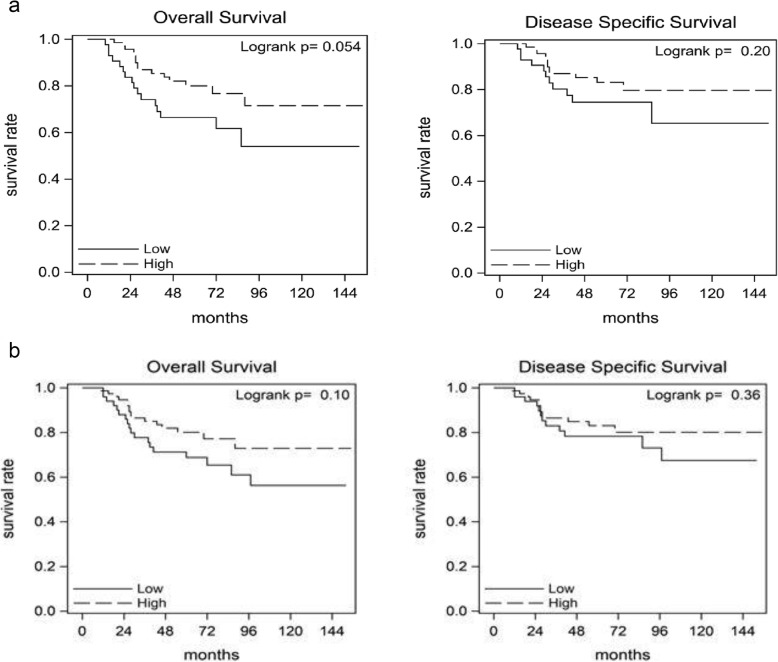
Fig. 2.
Kaplan-Meier plots of triple-negative breast cancer-specific survival in the WCHS population, stratified by CD8+ T cell density. a Survival curves for Black patients with triple-negative breast cancer. CD8+ T cell density was categorized into low vs. high based on the median value of CD8+ cells/mm2 for the Black population. b Survival curves for Black and White patients with triple-negative breast cancer. CD8+ T cell density was categorized into low vs. high based on the median value of CD8+ cells/mm2 for the overall WCHS population

