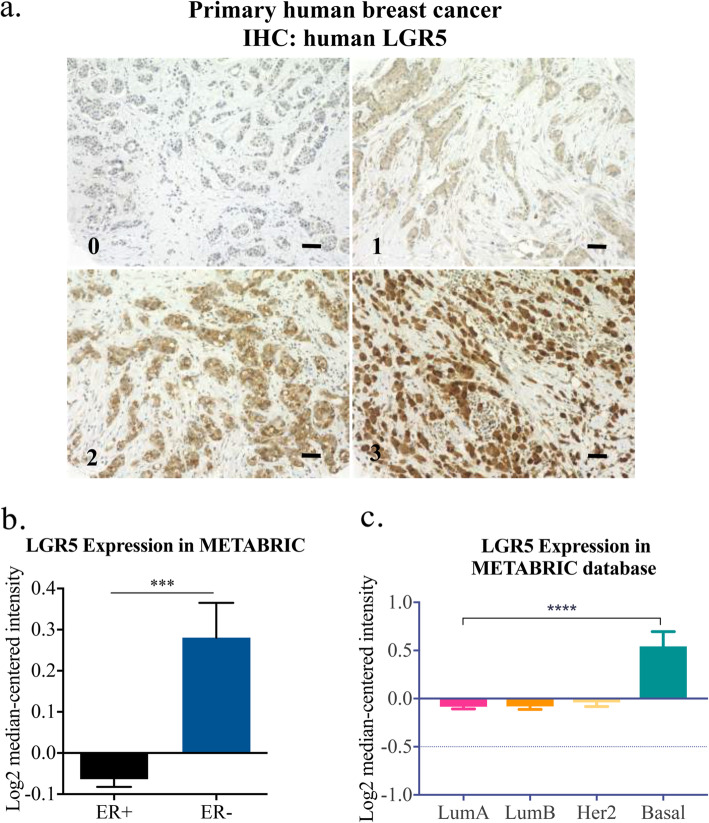
Fig. 1.
LGR5 and clinicopathological features in BC. a Representative images of LGR5-stained primary human BC (numbers on bottom left of each image indicate score for tumor staining intensity). Scale bar, 50 μM. b Analysis of patient samples in METABRIC database for LGR5 expression in >ER− vs. ER+ BC show elevated LGR5 expression in ER− BC. c Various BC subtypes with Basal BC showing a statistically significant elevation in LGR5 expression compared to Luminal A, Luminal B, and Her2, mean ± SEM. (Student t-test, ***P < 0.001, ****P < 0.0001)

