Figure 1.

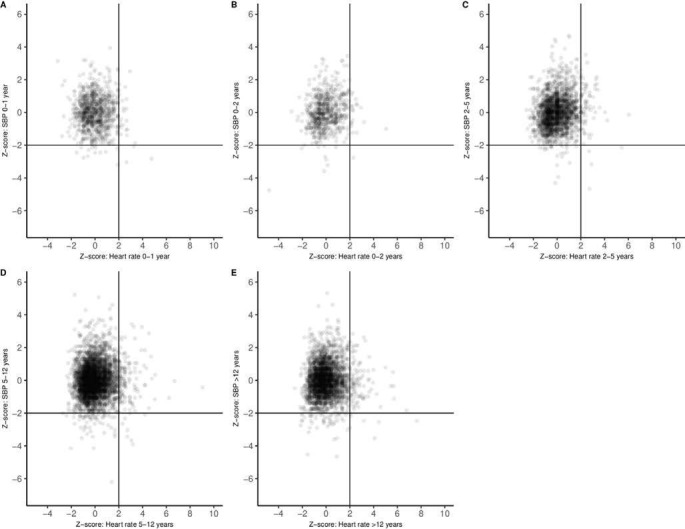
Scatter plots of z-scores of heart rate and systolic blood pressure (SBP) for different age categories (A; 0–1 year, B; 1–2 years, C; 2–5 years, D; 5–12 years, E; 12–16 years).

Scatter plots of z-scores of heart rate and systolic blood pressure (SBP) for different age categories (A; 0–1 year, B; 1–2 years, C; 2–5 years, D; 5–12 years, E; 12–16 years).