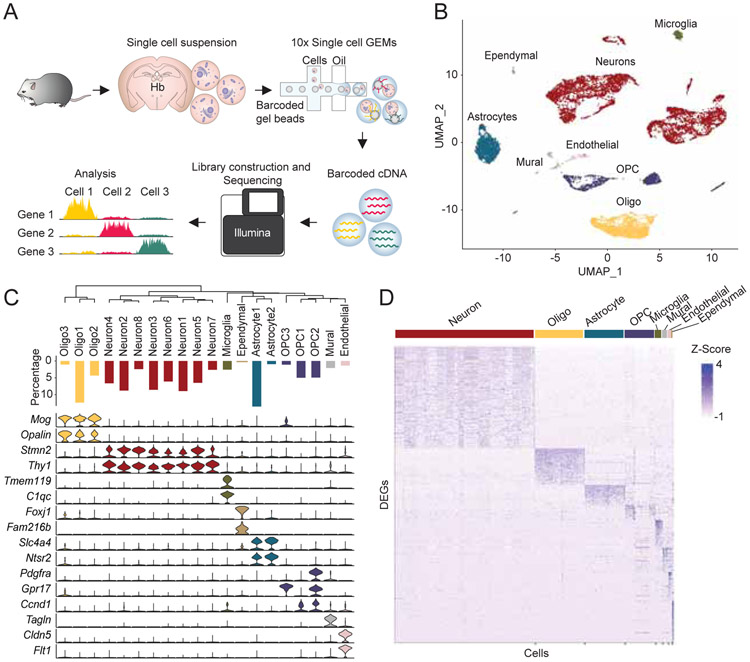
Figure 1. Single cell RNAseq analysis on mammalian habenula.
A. Schematic of scRNAseq experiments. B. UMAP dimensional reduction and visualization of transcriptional profiles of 11,878 habenular cells. C. Top: dendrogram showing relationships between clusters. Middle: proportions of cells in each cluster. Bottom: violin plots showing levels of expression of canonical marker genes in neuronal and non-neuronal cells. D. Heat map showing scaled expression of all marker genes in each cell class (e.g. Neuron). Related to Figure S1.

