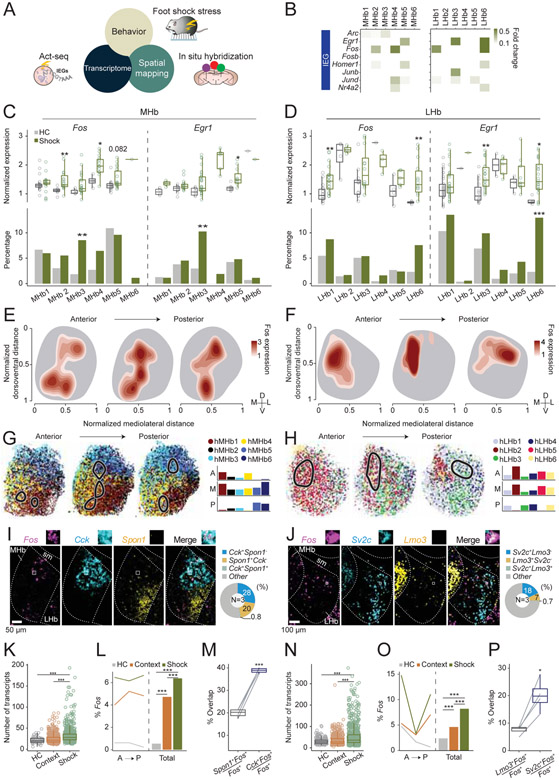
Figure 7. Activation of habenular clusters by aversive stimulus.
A. Act-seq (B-D) and multiplexed FISH (E-P) were used to identify transcriptionally defined populations responsive to aversive stimulus. B. Heatmap illustrating log fold changes in expression levels of various IEGs at each cell type comparing shock and home cage groups. White, p>0.05 or fold change<0.1. C, D. Comparison of Fos and Egr1 expression values in the expressing cells (Top) and the proportions of expressing cells (Bottom) between home cage and shock groups in the scRNAseq experiments (C: MHb and D: LHb). Wilcoxon rank sum test (Top), and Fisher’s exact test (Bottom). *p <0.05, **p <0.01, ***p <0.001. E, F. Kernel density estimation maps of foot shock induced Fos expression in the MHb (E) and the LHb (F). The outlines of the MHb or the LHb were drawn based on the HiPlex experiments. G, H. Left: Fos dense areas in the Kernel density estimation maps (level>2.5; black line) were projected onto the maps of transcriptional clusters generated by HiPlex (Figure 5F,G) in the MHb (G) and the LHb (H). Right: The percentage of cells from each cluster, which were in the Fos dense area (level>2.5). I, J. Left: Representative images of Fos and various marker genes in the MHb (I) and the LHb (J). Right. Percentage of cells expressing marker genes. K, L, N, O. Comparisons of the numbers of Fos transcripts (K: MHb, N: LHb) or the percentage of Fos (+) cells (L:MHb, O: LHb) between home cage, context and foot shock groups. Wilcoxon rank sum test (K, N), and Fisher’s exact test (L, O). ***p <0.001. M, P. The percentage of Fos cells expressing various marker genes in the MHb (M) or in the LHb (P). Paired t-test. *p <0.05, ***p <0.001. Related to Figure S7.

