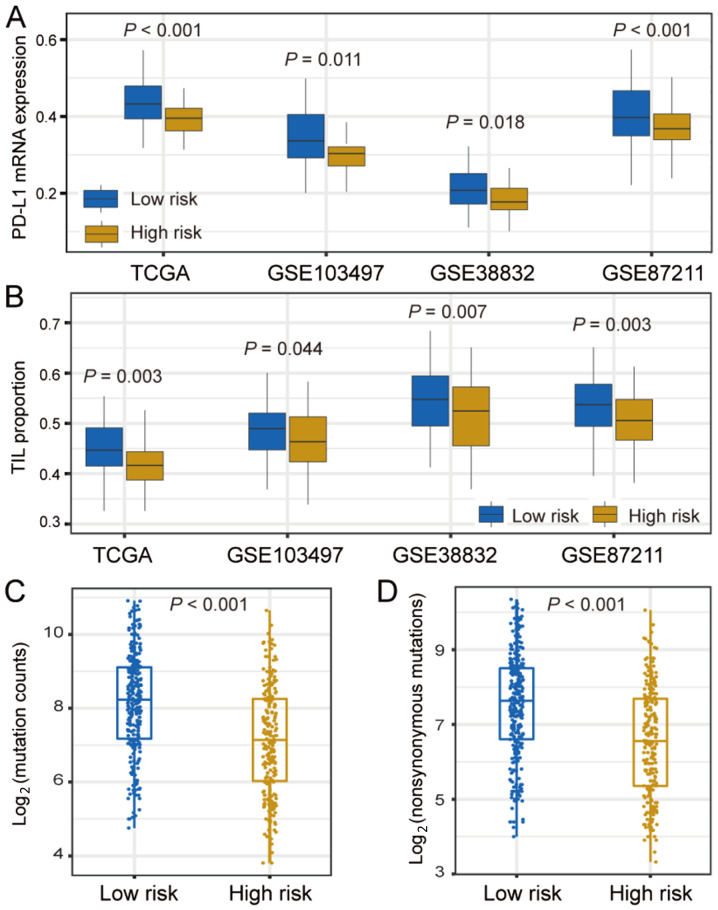
Figure 4.
Differences in PD-L1 expression, TIL proportion and TMB in low-risk vs. high-risk CRC subtypes. Differences in (A) PD-L1 expression and (B) TIL proportion in TCGA and three independent validation cohorts, stratified by the two CRC subtypes. (C and D) Association of TMB with low-risk and high-risk CRC subtypes. CRC, colorectal cancer; TCGA, The Cancer Genome Atlas; PD-L1, programmed death-ligand 1; TIL, tumor-infiltrating lymphocyte; TMB, tumor mutation burden.

